Atlantropa: Dam Gibraltar and Let Evaporation Do the Work
The What-If Observatory Published
Cut the Mediterranean off from the Atlantic and it loses only about 0.25 to 0.57 meters of water a year. That is the slow engine of Atlantropa, the 1920s plan by German architect Herman Sörgel to dam the strait and let evaporation lower the sea. On the water budget in a 2013 review, with the sea's area held fixed and seepage left out, a fall of 100 to 200 meters takes roughly two to eight centuries, depending on the evaporation figure and the Black Sea.
Steps in this reading (6)
- Suppose:
- dams close the sea at Gibraltar, with or without Gallipoli; it falls 100 m, then 200 m (our figures).
- Hold fixed:
- that 2013 water budget; a fixed sea area; no seepage; no other inflow change.
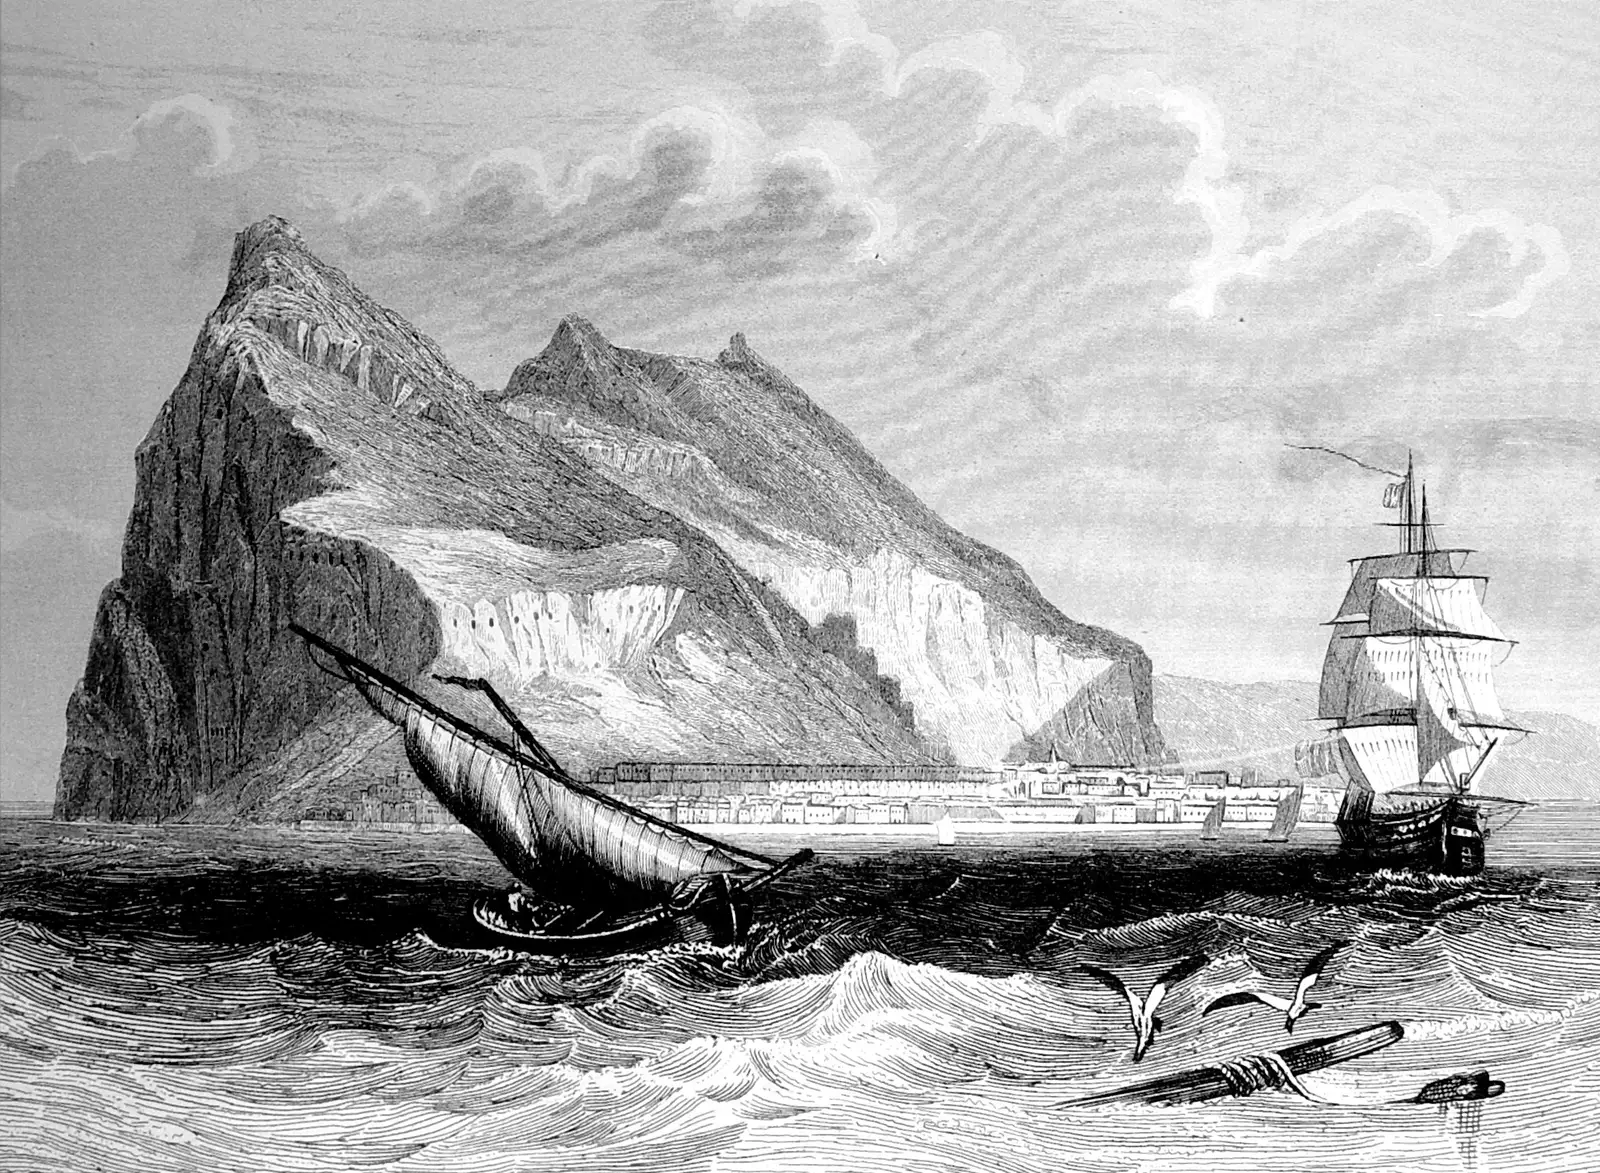
Gibraltar in an engraving from the Spanish history Las glorias nacionales, 1853. The engraver is not named. It shows the rock and its shipping, not any dam or plan for one.
"Gibraltar engraving" by unknown creator — https://commons.wikimedia.org/wiki/File:Gibraltar_engraving_1852.jpg — Public domain in the US (published 1853) and in the EU (anonymous engraver, published 1853, 70 years passed); modified: scan speckle removed with a 3 px median, card view cropped to 16:9

What did Sörgel propose?
A giant dam at Gibraltar, smaller dams at the Suez Canal and at Gallipoli, and then patience: that is how Philipp Lehmann, writing on Harvard's Energy History site, sums up the plan Herman Sörgel drew up in the 1920s and first called Panropa.
No pumps do the draining in Lehmann's account, because once the sea is closed off, evaporation slowly lowers the water, and the growing drop stores energy behind the Gibraltar dam for hydropower generators to turn into electricity.
So yes, someone really did want to build this. It was taken seriously at the time: Lehmann says newspapers followed it closely, modernist architects drew parts of it, and geologists argued over what moving so much water would do.
The power was meant to serve a much wider scheme: desalinated water to irrigate North Africa, giant reservoirs to change its climate, and a single political order joining Europe and Africa. Those are Sörgel's arguments as Lehmann reports them, made from interwar Germany about land on another continent. We report them as claims and leave the politics ungraded.
We could not read Sörgel's own book, so his design sea levels and dam length stay off this page, and the 100 m and 200 m below are our round test figures, which nothing here attributes to him.
How fast would the sea fall?
About 0.25 to 0.57 meters a year. That is far slower than the flow through the strait would suggest.
Step 1: the budget. A 2013 review in Ocean Science by T. Tanhua and colleagues gives the sea an area of 2.5 × 10^12 square meters. Citing Mariotti and colleagues, a 2002 paper we could not read, it puts evaporation at 0.074 to 0.093 sverdrups and precipitation at 0.026 to 0.037. One sverdrup (Sv) is a million cubic meters of water per second.
For the net, the review prints about 0.039 to 0.055 Sv, a range from the same paper and not a subtraction of those end points. Again citing earlier work, it has rivers adding about 0.010 Sv and the Black Sea sending in 0.039 Sv while taking back 0.030, which is a net 0.009 by our subtraction.
As a depth, evaporation takes about 0.93 to 1.17 meters off the sea every year and precipitation returns about 0.33 to 0.47. The printed net comes to about 0.49 to 0.69 meters, the shortfall the Atlantic refills today before rivers are counted.
Each step here carries a Seeing mark, a term borrowed from astronomy for how much the air smears a view, and we use it to rate how much a step can bear. Seeing: hazy, because these are ranges cited at second hand.
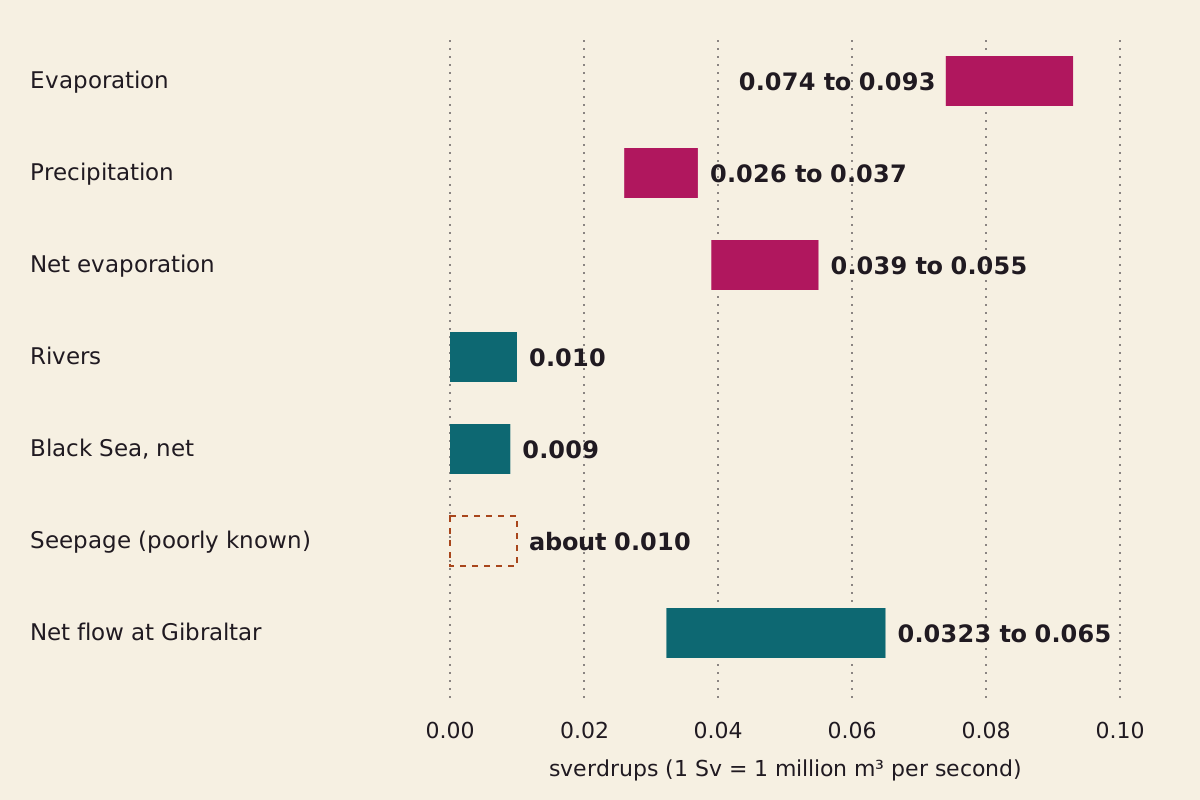
The Mediterranean's water budget in sverdrups. Only the difference between what leaves and what arrives can move the sea level. The Gibraltar bar spans three published central figures. The seepage box is dashed because its size is poorly known.
"The Mediterranean water budget" by The What-If Observatory, https://whatifobservatory.com/what-if/atlantropa/, licensed under CC BY 4.0 (https://creativecommons.org/licenses/by/4.0/)
Data: Tanhua et al. 2013, Ocean Science, CC BY 3.0 (budget terms, citing earlier work); Liu et al. 2025, Ocean Science, CC BY 4.0 (Gibraltar net flow, citing earlier work)
Why doesn't the dam drain the sea?
Today the strait works like a two-lane road. Tanhua's review calls the sea an evaporation basin, and a paper we come to in step 5 describes fresher Atlantic water moving east in the upper layer while saltier Mediterranean water moves west below about 150 m.
Most of what comes in therefore goes back out again, and only a small remainder replaces what the air takes. Since that lower lane runs below about 150 m, the dam would have to stand in deeper water than that before the sea had fallen at all.
There is a tempting wrong sum here. The same review puts the Atlantic inflow at Gibraltar at 0.72 to 0.92 Sv, some 22 to 28 times the lowest net flow in step 5, and if you stop that alone the sea seems to fall 9 to 12 meters a year, reaching 100 m in about a decade.
A dam stops the way out as well, and the review puts that outflow at 0.68 to 0.88 Sv. To reach 100 m in ten years, the sea would have to lose about 0.79 Sv. The net loss in step 2 covers only a sliver of that, so pumps would have to move about 0.75 to 0.77 Sv, close to the strait's entire inflow. No plan we read proposes that.
So the dam does not drain the sea; it only stops the refill.
What does the sea actually lose?
Step 2: the net loss. Lehmann's dam at Gallipoli would also close the Black Sea route, leaving rivers as the only inflow we count: 0.029 to 0.045 Sv lost. With a dam at Gibraltar alone, the Black Sea keeps flowing and the loss is 0.020 to 0.036 Sv. The budget we read lists no flow through Suez, so that dam changes nothing in these sums. Seeing: hazy.
Step 3: the rate. Divide by the area. Both dams give 0.37 to 0.57 meters a year, and Gibraltar alone gives 0.25 to 0.45. In daily terms the whole range is 0.7 to 1.6 millimeters, which nobody on a beach could see against the waves. With both dams, the yearly loss is 915 to 1,420 cubic kilometers.
For scale, a Great Pyramid of water, at the 2.5 million cubic meters implied by a USGS column, would leave every 56 to 86 seconds. The magma of the largest Yellowstone eruption in USGS figures, about 2,438 cubic kilometers, would match 1.7 to 2.7 years of that loss.
Step 4: the clock. A 100 m fall removes 250,000 cubic kilometers at a fixed area, and a 200 m fall removes twice that. The table runs each case. Seeing: hazy, because the depths are ours and the area will not really stay fixed.
| Case | Net loss (Sv) | Fall (m a year) | Years to 100 m | Years to 200 m |
|---|---|---|---|---|
| Both dams, high evaporation | 0.045 | 0.57 | 176 | 352 |
| Both dams, low evaporation | 0.029 | 0.37 | 273 | 546 |
| Gibraltar only, high evaporation | 0.036 | 0.45 | 220 | 440 |
| Gibraltar only, low evaporation | 0.020 | 0.25 | 396 | 792 |
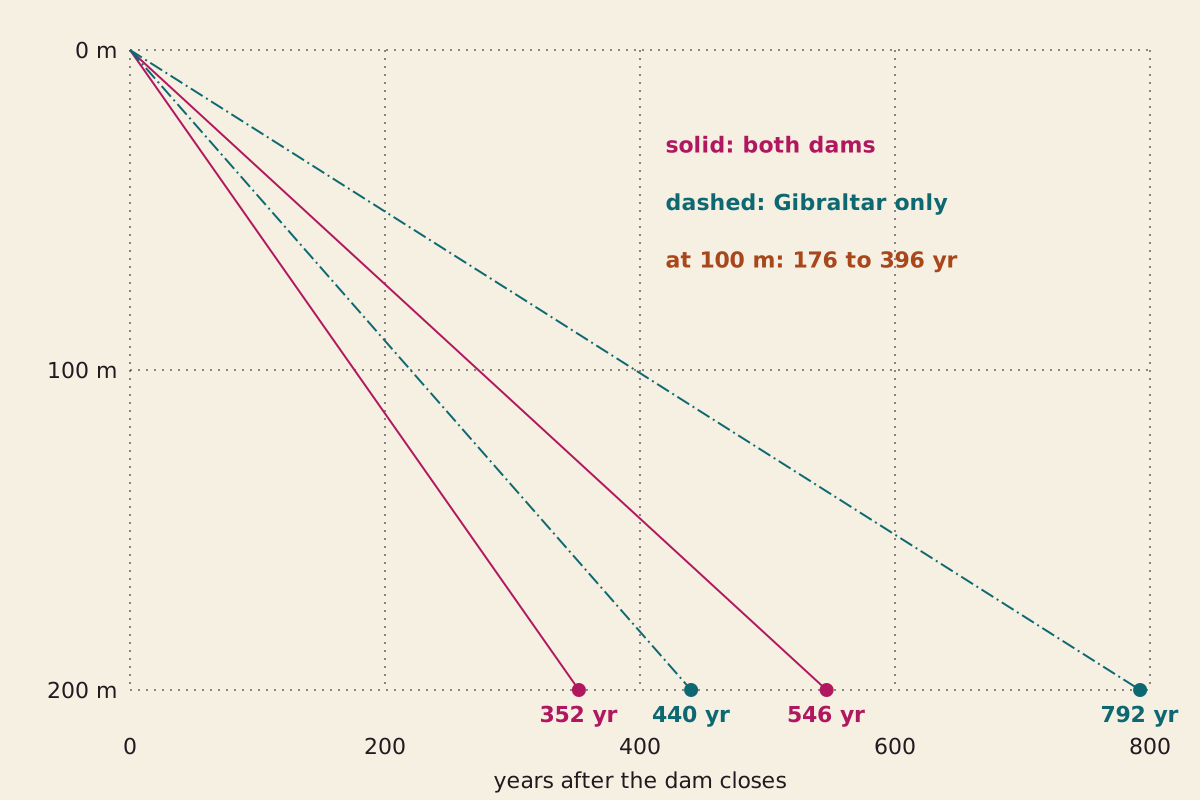
Each line is one row of the table: a steady fall at a fixed area. The depths are our test figures, not design figures from the 1920s plan.
"How fast the sea would fall" by The What-If Observatory, https://whatifobservatory.com/what-if/atlantropa/, licensed under CC BY 4.0 (https://creativecommons.org/licenses/by/4.0/)
Data: Tanhua et al. 2013, Ocean Science, CC BY 3.0 (budget terms and area, citing earlier work)
Download atlantropa-fall-scenarios.csv (where its values come from)
A date makes the slowness easier to feel. Pick 1930 for the closing, a year we chose for the sum since no dam was ever built, and by 2026 the sea would have fallen only 24 to 55 meters across these cases.
This range leaves one thing out. Tanhua's review says freshwater seeping up through the sea floor is poorly constrained and likely similar in size to the rivers. Count 0.010 Sv of it, and the slowest case falls 0.13 meters a year and needs about 1,584 years for 200 m. Seeing: overcast on that figure, since the size of the seepage is the unknown.
The budget itself also moves. Tanhua's review says river flow has changed over time, most of all the Nile's after damming, and that the Black Sea flow varies widely, so a sum run over centuries borrows today's rates for a stretch of time when they would not hold still. That is the job of the Hold fixed line above.
Does a second road agree?
Step 5: a second road. A 2025 paper in the same journal, by C. Liu and colleagues, gives three figures for the net flow through the strait. If the sea holds level today, that inflow must equal the loss a dam at Gibraltar would expose, so each one sets its own clock.
| Net flow at the strait (Sv) | Whose figure, as Liu reports it | Fall (m a year) | Years to 100 m | Years to 200 m |
|---|---|---|---|---|
| 0.0323 ± 0.0018 | García-García and colleagues, 2005 to 2010 | 0.41 | 245 | 491 |
| 0.05 ± 0.02 | Liu's own ocean model estimate, 2003 to 2017 | 0.63 | 158 | 317 |
| 0.065 ± 0.033 | Jordà and colleagues, from nearly 20 estimates | 0.82 | 122 | 244 |
We read Liu, not the two earlier studies, and we show all three because we can't justify picking one. Each clock uses the central figure. The lowest lands inside the Gibraltar-only row, 1.6 times above its low end and 1.1 times below its high end. The central figures of the other two run faster than the whole row, 1.4 and 1.8 times past its high end, though their ± ranges reach back into it.
That is two-road agreement, our name for two estimates from different inputs that land within 3 times of each other, on five of the six pairings between the three figures and the row's two ends. The sixth, 0.065 against the row's low end, is 3.25 times apart, so it misses the test and we mark it overcast.
So the strait's central figures favor the fast half of our range, and its top figure beats our fast end. Both roads share the same area and today's climate. Seeing: hazy on those five pairings.
A flow measured at the strait would already include any seepage, though we could not check how these were derived. The 0.010 Sv left in our seepage case sits 3.2 times below even the lowest of them, a second reason for its overcast mark.
How much sea floor would appear?
We can give you a test, not a map. How much land a falling sea uncovers depends on the slopes below today's coasts, and the GEBCO grid of world sea-floor depths could answer that. It is in the public domain, but we have not run it for this page, so no measured area appears here.
Step 6: a shrinking sea. Try three test values for the sea area left at 200 m. Each 10 percent is 250,000 square kilometers of new ground, about 3.1 percent of the 48 contiguous US states by the Census Bureau's area.
A smaller sea also evaporates less, while the rivers keep arriving, so the fall slows as it goes. To run that, we let the area shrink in a straight line down to each test value. These are our inputs and not a survey of the basin. Seeing: hazy.
| Area left at 200 m | Sea floor exposed (km²) | Fastest case to 200 m (years) | Slowest case to 200 m (years) |
|---|---|---|---|
| 100% | 0 | 352 | 792 |
| 90% | 250,000 | 356 | 836 |
| 80% | 500,000 | 361 | 895 |
| 70% | 750,000 | 368 | 986 |
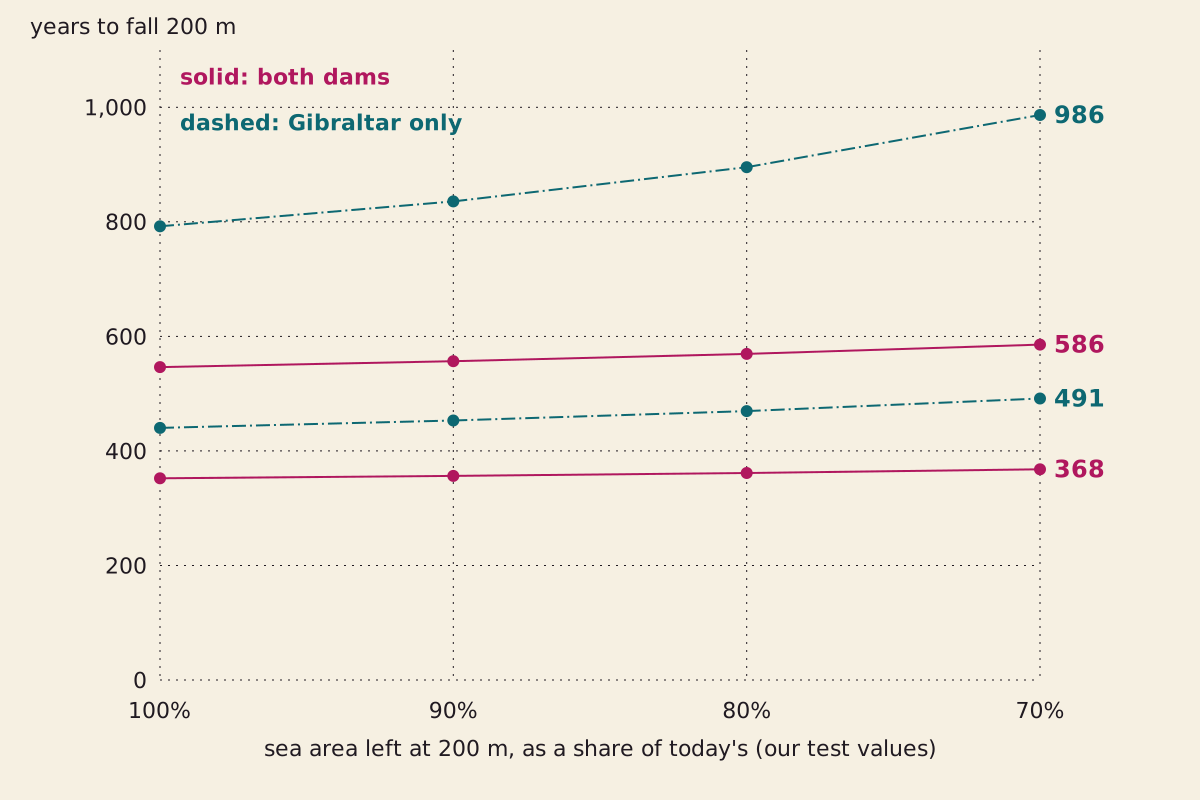
Years to fall 200 m under our straight-line shrink test. The fast end hardly moves. The slow end stretches because its inflow is closest to its evaporation.
"The clock if the sea shrinks as it falls" by The What-If Observatory, https://whatifobservatory.com/what-if/atlantropa/, licensed under CC BY 4.0 (https://creativecommons.org/licenses/by/4.0/)
Data: Tanhua et al. 2013, Ocean Science, CC BY 3.0 (budget terms and area, citing earlier work)
The reason is in the ratio. In the fastest case, inflow is 0.010 Sv against 0.055 Sv of net evaporation, so a smaller sea barely changes the gap between them, while in the slowest case inflow is 0.019 Sv against 0.039 Sv, and the same shrink eats a much larger share of the gap.
So the fixed-area shortcut barely touches the fast end and, at our 70 percent test, costs the slow end about two centuries. It says nothing about any one coast. Our sum on the Moon at half its distance stops short of shorelines for the same reason: basins decide those, and a budget does not.
One result needs no grid at all. At a 100 m fall, every quay on today's coast would stand 100 m farther above the water, unless the harbor moved down after it.
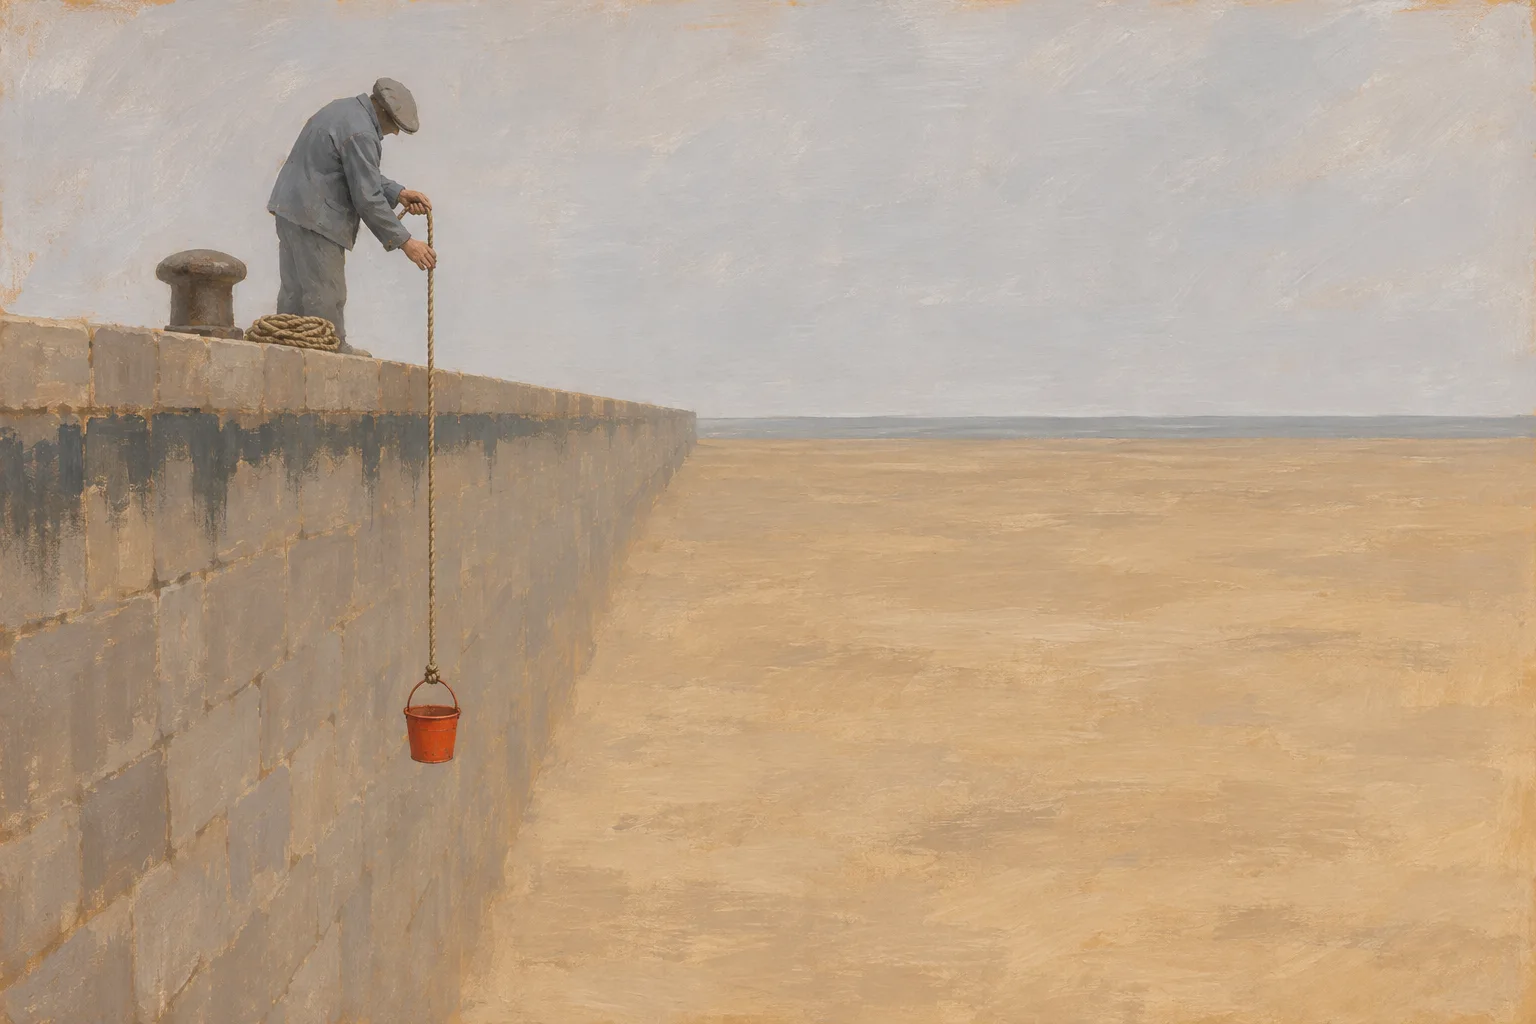 Illustration
At a 100 m fall, a quay on today's coast would stand 100 m farther above the water. Not to scale.
Illustration: The What-If Observatory. Generated schematic illustration — not a photograph or historical record. © The What-If Observatory, all rights reserved.
How much power could the dam make?
About 20 to 90 gigawatts on our upper-limit sum from the 2013 budget. Evaporation sets the limit, not the turbines.
Step 7: head times flow. Power is water density times gravity times flow times head, the drop across the dam. To hold the sea at one level, you can only let in what evaporation removes, because any more would raise the sea and shrink the drop.
The net loss from step 2 is therefore also the steady flow through the turbines, and the only new input is density, which we take as 1,025 kilograms per cubic meter. Seeing: hazy.
So the plan's engine and its brake are the same number.
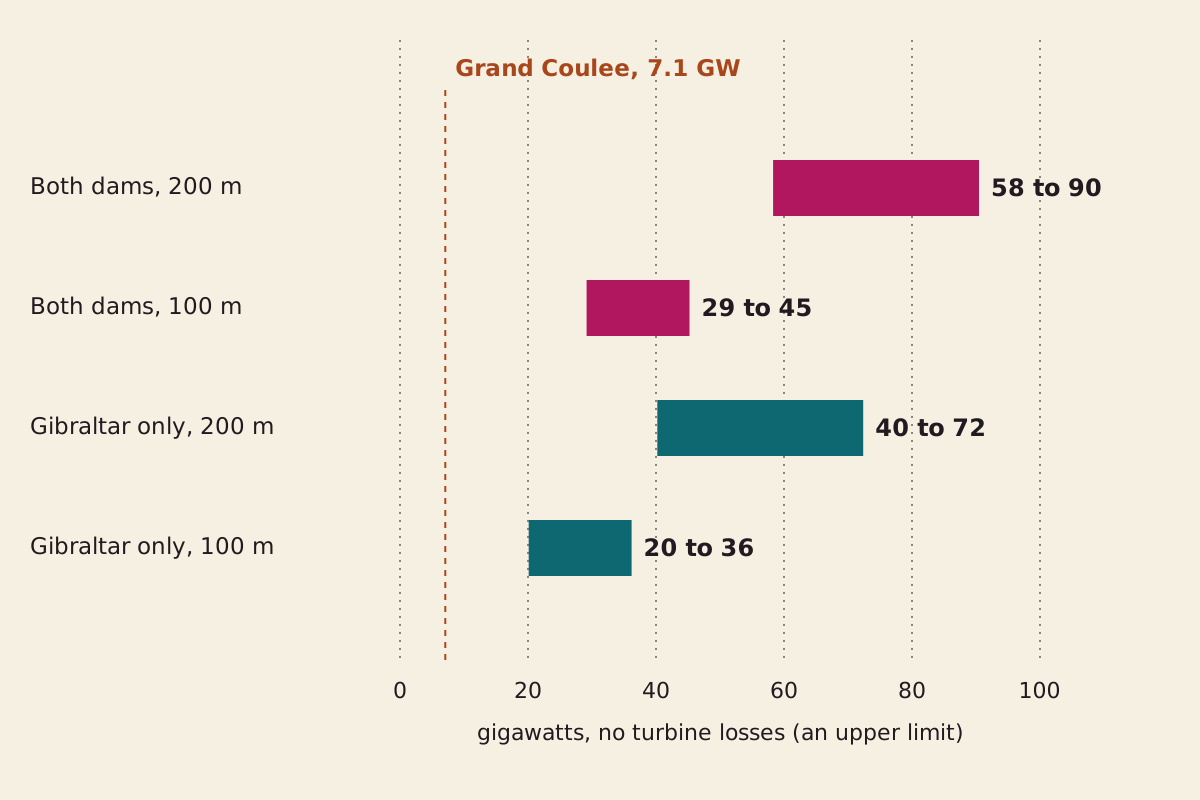
Power on the 2013 budget if every joule reached the grid, which no plant manages, so read these as ceilings. The dashed line is the largest US power plant by capacity, reported for 2022.
"Power from net evaporation" by The What-If Observatory, https://whatifobservatory.com/what-if/atlantropa/, licensed under CC BY 4.0 (https://creativecommons.org/licenses/by/4.0/)
Data: Tanhua et al. 2013, Ocean Science, CC BY 3.0 (budget terms, citing earlier work); US Energy Information Administration (Grand Coulee capacity)
Both dams give 29 to 45 gigawatts at 100 m and 58 to 90 at 200 m. Gibraltar alone gives 20 to 36 and 40 to 72. Grand Coulee, the largest US plant in the Energy Information Administration's 2022 table, has a summer capacity of 7,079 megawatts, so the top row is about 8 to 13 of them.
The higher strait flows in step 5 would lift the Gibraltar-only figure at 200 m to about 101 and 131 gigawatts, so these ceilings are only as firm as the budget under them.
If the sea has also shrunk by 20 percent at 200 m, the both-dams figure falls to about 43 to 68 gigawatts, since less surface means less loss to replace.
The wait comes first. After ten years the drop is only 2.5 to 5.7 meters, and 10 m takes 18 to 40 years. At a 1 m drop, the low both-dams flow gives about 0.29 gigawatts, and every turbine run before the target level also slows the fall. Even the dam we imagined closing in 1930 would have ceilings of only about 5 to 25 gigawatts at its 2026 level.
Has the Mediterranean dried up before?
Yes, by the account we read. A 2010 review in PLOS ONE by Marta Coll and colleagues says the sea was once cut off from the world ocean and nearly dried out in the Messinian crisis, about 5.96 million years ago. It says the reopening of the Strait of Gibraltar 5 million years ago let the sea restock.
Step 8: where the fall stops. Our sum, on today's rates, ends in a smaller sea and not an empty basin, because net evaporation falls as the sea shrinks, until it matches the fixed inflow. With rivers alone, that happens at 18 to 26 percent of today's area, and with the Black Sea still flowing, it happens at 35 to 49 percent. Seeing: hazy, because this holds evaporation per square meter steady in a sea that would be getting saltier.
Seepage moves the stopping point too. Add 0.010 Sv and the shares become 36 to 51 percent and 53 to 74 percent, and the slowest case under our 70 percent test would stop near 171 m without reaching 200. Seeing: overcast on those.
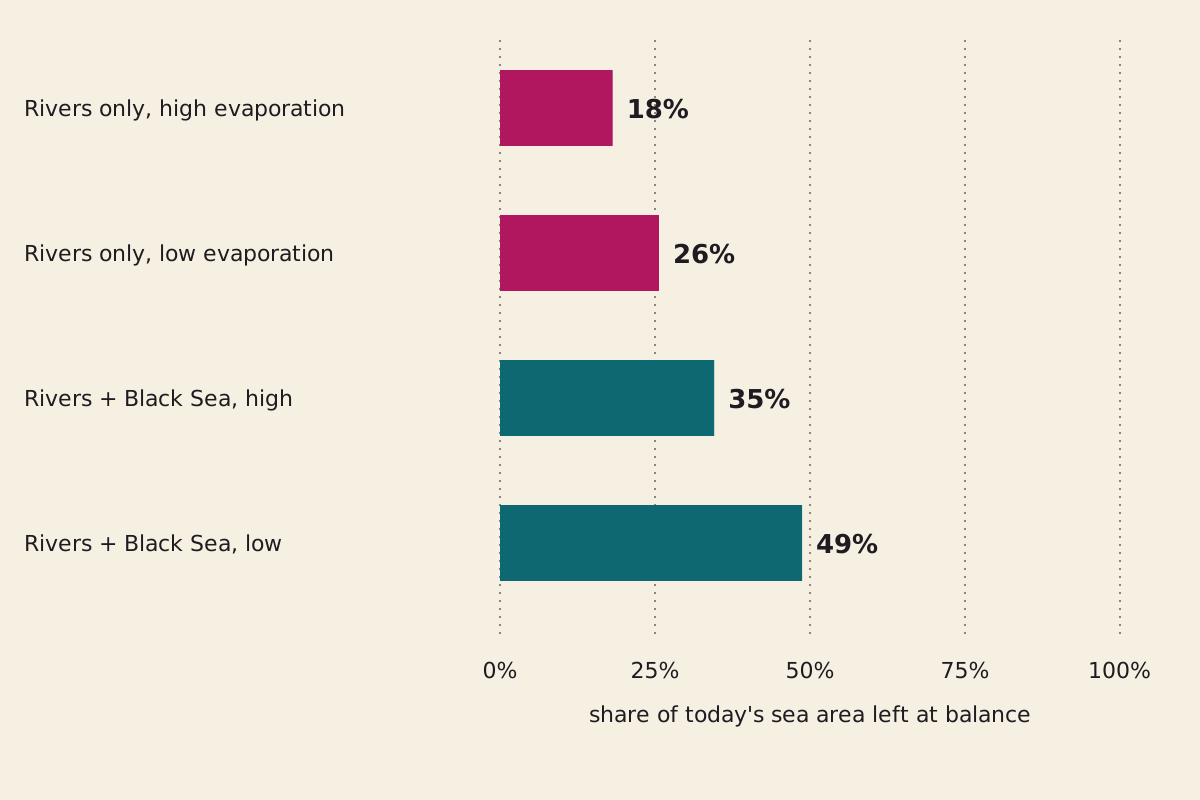
The area at which net evaporation would equal inflow, on today's rates with seepage left out. We have no grid, so we cannot turn these shares into a depth.
"Where the fall would stop on today's rates" by The What-If Observatory, https://whatifobservatory.com/what-if/atlantropa/, licensed under CC BY 4.0 (https://creativecommons.org/licenses/by/4.0/)
Data: Tanhua et al. 2013, Ocean Science, CC BY 3.0 (budget terms, citing earlier work)
We can't line that up with the Messinian record. Ours is a share of surface area.
The review's words are “near drying out” (Introduction) and “almost complete desiccation” (What is hidden in the deep?), its Temporal trends section adds that some shallow areas remained, and it gives no area. A sea at a fifth of its area might have lost most of its water or far less, and without a grid we can't say which, so we can't call the two a match or a clash.
Nor did we read a water budget for that time, when the review says climate and sea level changed drastically. We won't guess at one.
Plato's story puts Atlantis in front of the straits he calls the Pillars of Heracles, so this water already carries one tale about land and sea trading places. Plato gave no budget for his. This one has a budget, and it still has gaps.
Why was Atlantropa never built?
We can't tell you, because the page we read calls the project unrealized and gives no reason. Our sums show a wait of centuries, but that is arithmetic and not a historical cause. A big machine can come with figures you can check and still stay on paper, as Verne's 900-foot cannon did.
Step 9: the rest of the sea. A dam also stops the outflow that carries salt out of the Mediterranean today, so salt would stay behind as the water left. Sörgel argued his reservoirs would change North Africa's climate. Neither of those claims comes with numbers we could read for this case, and neither does the fate of the sea's life.
The dotted line falls after step 8. Up to there, every reading has a named source or an assumption we state, and the arithmetic reruns from the table below. Step 9 asks how salty the sea would get, what the weather would do and what would live in it. From here on, we are guessing.
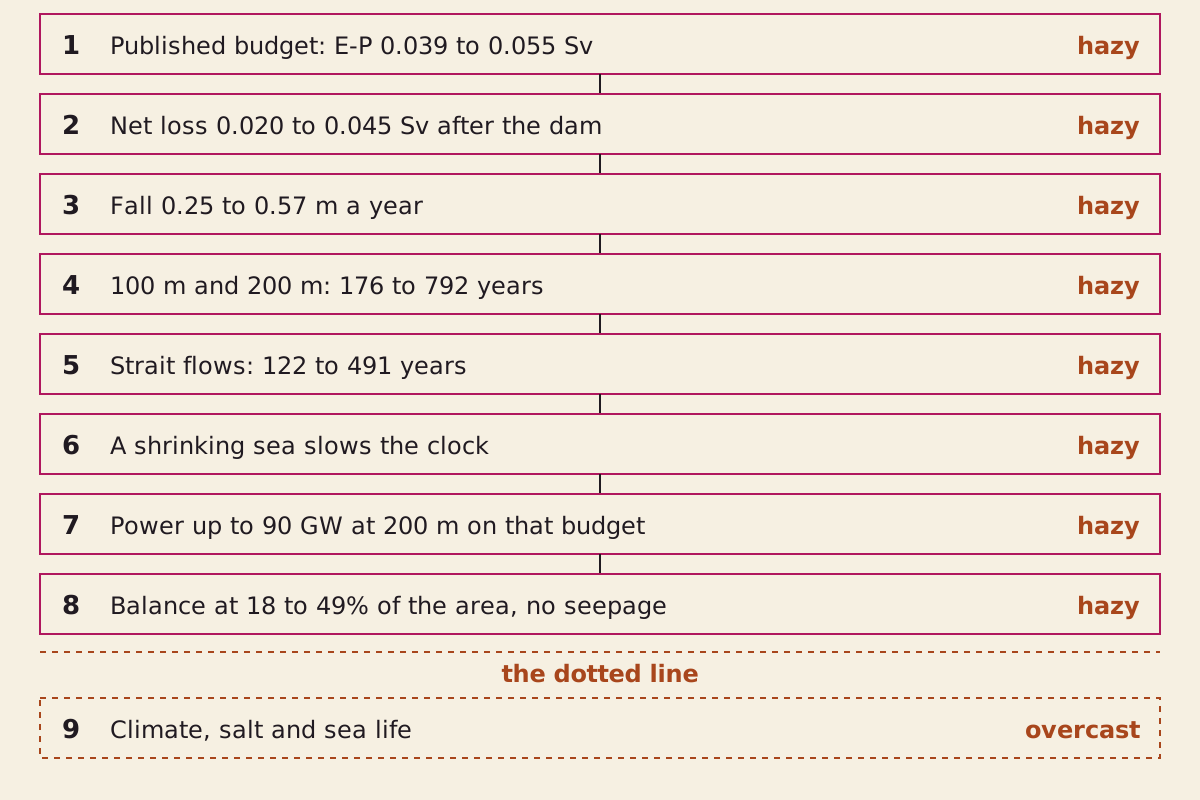
The chain behind this page. Steps 1 to 8 rest on named sources and stated assumptions. Step 9 sits past the dotted line.
"Atlantropa step chain" by The What-If Observatory, https://whatifobservatory.com/what-if/atlantropa/, licensed under CC BY 4.0 (https://creativecommons.org/licenses/by/4.0/)
Data: Tanhua et al. 2013, Ocean Science, CC BY 3.0; Liu et al. 2025, Ocean Science, CC BY 4.0
So the budget, the clock and the power ceiling sit above that line. The climate, the salt and the sea life sit below it. Seeing: overcast.
Check my math:
| Step | Input | Value | Unit | Source no. | Source | Recomputed | Seeing |
|---|---|---|---|---|---|---|---|
| 1 | Evaporation | 0.074–0.093 | Sv | 1 | secondary | no | hazy |
| 1 | Precipitation | 0.026–0.037 | Sv | 1 | secondary | no | hazy |
| 1 | Net evaporation | 0.039–0.055 | Sv | 1 | secondary | no | hazy |
| 1 | Rivers | 0.010 | Sv | 1 | secondary | no | hazy |
| 1 | Black Sea net: 0.039 − 0.030 | 0.009 | Sv | 1 | secondary | yes | hazy |
| 1 | Sea area | 2.5 × 10^12 | m² | 1 | secondary | no | hazy |
| 1 | Evaporation as a depth | 0.93–1.17 | m a year | 1 | site assumption | yes | hazy |
| 1 | Precipitation as a depth | 0.33–0.47 | m a year | 1 | site assumption | yes | hazy |
| 1 | Wrong sum: 0.92 Sv ÷ area | 11.6 | m a year | 1 | site assumption | yes | hazy |
| 1 | Total loss for 100 m in ten years | 0.79 | Sv | 1 | site assumption | yes | hazy |
| 1 | Pumping on top of the net loss | 0.75–0.77 | Sv | 1 | site assumption | yes | hazy |
| 2 | Net loss, both dams | 0.029–0.045 | Sv | 1 | site assumption | yes | hazy |
| 2 | Net loss, Gibraltar only | 0.020–0.036 | Sv | 1 | site assumption | yes | hazy |
| 3 | Fall rate, all cases | 0.25–0.57 | m a year | 1 | site assumption | yes | hazy |
| 3 | Loss, both dams | 915–1,420 | km³ a year | 1 | site assumption | yes | hazy |
| 3 | One Great Pyramid of water | 56–86 | s | 1, 9 | site assumption | yes | hazy |
| 3 | Yellowstone magma in years of loss | 1.7–2.7 | years | 1, 8 | site assumption | yes | hazy |
| 4 | Years to 100 m | 176–396 | years | 1 | site assumption | yes | hazy |
| 4 | Years to 200 m | 352–792 | years | 1 | site assumption | yes | hazy |
| 4 | Fall by 2026 if closed in 1930 (our pick) | 24–55 | m | 1 | site assumption | yes | hazy |
| 4 | Years to 200 m, seepage at 0.010 Sv | 1,584 | years | 1 | site assumption | yes | overcast |
| 5 | Net flow at Gibraltar, 2005–2010 | 0.0323 ± 0.0018 | Sv | 3 | secondary | no | hazy |
| 5 | Net flow at Gibraltar, 2003–2017, model estimate | 0.05 ± 0.02 | Sv | 3 | primary | no | hazy |
| 5 | Net flow at Gibraltar, pooled estimates | 0.065 ± 0.033 | Sv | 3 | secondary | no | hazy |
| 5 | Years to 100 m, those three central flows | 122–245 | years | 1, 3 | site assumption | yes | hazy |
| 5 | Years to 200 m, those three central flows | 244–491 | years | 1, 3 | site assumption | yes | hazy |
| 5 | Widest gap: 0.065 Sv against 0.020 Sv | 3.25 | times | 1, 3 | site assumption | yes | overcast |
| 6 | Each 10% of area | 250,000 | km² | 1 | site assumption | yes | hazy |
| 6 | Same as a share of the 48 states | 3.1 | percent | 1, 10 | site assumption | yes | hazy |
| 6 | Years to 200 m, 70% of area left | 368–986 | years | 1 | site assumption | yes | hazy |
| 7 | Standard gravity | 9.80665 | m/s² | 7 | primary | no | clear |
| 7 | Seawater density | 1,025 | kg/m³ | — | site assumption | no | hazy |
| 7 | Power at 100 m, all cases | 20–45 | GW | 1, 7 | site assumption | yes | hazy |
| 7 | Power at 200 m, all cases | 40–90 | GW | 1, 7 | site assumption | yes | hazy |
| 7 | Gibraltar only at 200 m, two higher strait flows | 101, 131 | GW | 3, 7 | site assumption | yes | hazy |
| 7 | Ceiling at that 2026 level | 5–25 | GW | 1, 7 | site assumption | yes | hazy |
| 7 | Grand Coulee, summer capacity, 2022 | 7,079 | MW | 5 | primary | no | clear |
| 8 | Area at balance, rivers only | 18–26 | percent | 1 | site assumption | yes | hazy |
| 8 | Area at balance, Black Sea flowing | 35–49 | percent | 1 | site assumption | yes | hazy |
| 8 | Area at balance, all cases, seepage at 0.010 Sv | 36–74 | percent | 1 | site assumption | yes | overcast |
| 8 | Where the slowest case stops, seepage and 70% test | 171 | m | 1 | site assumption | yes | overcast |
| 9 | Climate, salt and sea life after the fall | — | — | 4 | secondary | no | overcast |
Download atlantropa-check-my-math.csv (where its values come from)
Next question:
- What if the Moon came closer? The Moon at half its distance
- What if Plato's ditch were real? Plato's Atlantis
Sources
- Tanhua, T., Hainbucher, D., Schroeder, K., Cardin, V., Álvarez, M., and Civitarese, G. (2013). “The Mediterranean Sea system: a review and an introduction to the special issue.” Ocean Science 9, 789–803. Original Read: full text; hydrology section used; last read 2026-11-08. Text license: CC BY 3.0.
- Lehmann, Philipp. “White Coal and New Continents.” Energy History, Center for History and Economics, Harvard University. Original Read: full page, paraphrased only; last read 2026-11-08.
- Liu, C., Liang, X., and Yu, L. (2025). “Salinity trends and mass balances in the Mediterranean Sea: revisit the role of air-sea freshwater fluxes and oceanic exchange.” Ocean Science 21, 2069–2083. Original Read: full page stored 2026-11-08; introduction and budget sections used; García-García et al. 2022 and Jordà et al. 2017 not read, only as reported here. Text license: CC BY 4.0.
- Coll, M., et al. (2010). “The Biodiversity of the Mediterranean Sea: Estimates, Patterns, and Threats.” PLoS ONE 5(8): e11842. Original Read: full page searched; the introduction and the Messinian passages used. Text license: CC BY.
- U.S. Energy Information Administration. “Electricity generation, capacity, and sales in the United States: top 10.” Last updated October 26, 2023. Original Read: single value from the capacity table.
- GEBCO Bathymetric Compilation Group 2026 (2026). “The GEBCO_2026 Grid: a continuous terrain model for oceans and land at 15 arc-second intervals.” Original Read: bibliography only, with the description and terms of use; the grid itself was not run for this page.
- National Institute of Standards and Technology. NIST Guide to the SI, Appendix B.8: Factors for Units Listed Alphabetically (Special Publication 811). Original Read: single value via the appendix table: foot, yard, standard acceleration of free fall.
- Jacob B. Lowenstern, Robert L. Christiansen, Robert B. Smith, Lisa A. Morgan, Henry Heasler (2005). “Steam Explosions, Earthquakes, and Volcanic Eruptions: What's in Yellowstone's Future?” USGS Fact Sheet 2005-3024. Original Read: full text; page 5 diagram viewed.
- Yellowstone Volcano Observatory. “In the pantheon of caldera eruptions, where does Yellowstone rank?” Yellowstone Caldera Chronicles, U.S. Geological Survey, July 3, 2023. Original Read: full column, last read 2026-11-08.
- U.S. Census Bureau. “State Area Measurements and Internal Point Coordinates.” Reference files, 2010. Original Read: single values from the state table: United States, Alaska and Hawaii rows.
Cite this page
The What-If Observatory. "Atlantropa: Dam Gibraltar and Let Evaporation Do the Work." Published 2026-11-09. https://whatifobservatory.com/what-if/atlantropa/. Add the date you read it.
Corrections
None so far.