What If a Yellowstone Eruption Repeated? USGS: Not ‘Overdue’
The What-If Observatory Published
The largest Yellowstone eruption in the USGS figures released about 585 cubic miles of magma, roughly 2,440 cubic kilometers. Spread evenly across the 48 contiguous states, that comes to about 30 cm, as an arithmetic layer and not an ash forecast. The US Geological Survey also says Yellowstone is not overdue: three large explosions give only two gaps, and it calls an average of two gaps meaningless.
Steps in this reading (7)
- How big were Yellowstone's three eruptions?
- Is Yellowstone overdue for an eruption?
- How deep would the ash be?
- Would the ash really fall evenly?
- Would a Yellowstone eruption wipe out the United States?
- Do earthquakes mean Yellowstone is about to erupt?
- Could a Yellowstone eruption change the climate?
- Check my math
- Suppose:
- Yellowstone repeats its largest known eruption.
- Hold fixed:
- USGS volumes; today's geography; no attempt at a date.
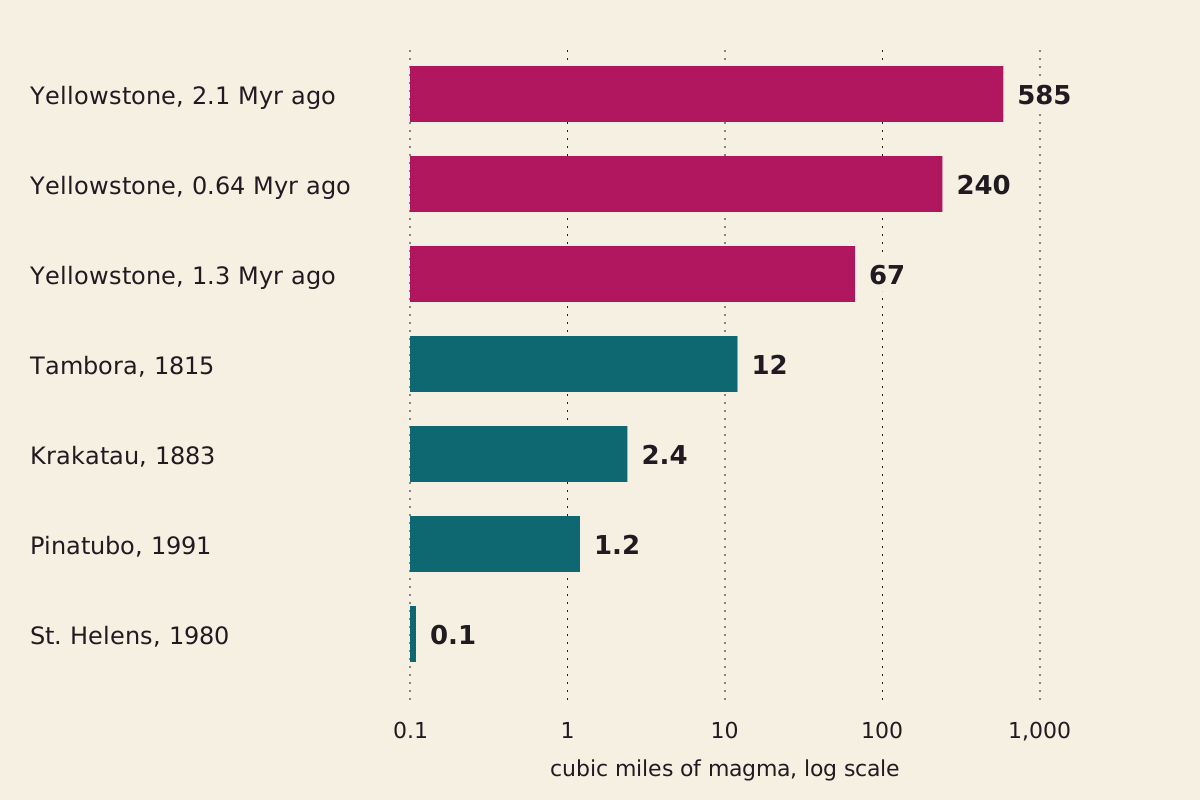
Magma volumes on a log scale, where each gridline is ten times the last. The figures come from a 2005 USGS fact sheet.
"Magma volumes of three Yellowstone eruptions and four others" by The What-If Observatory, https://whatifobservatory.com/what-if/yellowstone-eruption/, licensed under CC BY 4.0 (https://creativecommons.org/licenses/by/4.0/)
Data: USGS Fact Sheet 2005-3024 (magma volumes)
How big were Yellowstone's three eruptions?
About 585, 67 and 240 cubic miles of magma, oldest first. Those are the figures in USGS Fact Sheet 2005-3024, which dates the eruptions to 2.1 million, 1.3 million and 640,000 years ago. The sheet works back from ash and pumice to the molten rock they came from, so explosive eruptions can share one scale.
Step 1: the volume. The sheet prints the largest as 2,450 cubic kilometers, while exact conversion of 585 cubic miles gives 2,438, which is the figure we use. Each step here carries a Seeing mark, a label taken from astronomy, where steadier air shows finer detail, and it rates how much weight a step can bear. Seeing: hazy, because a 2023 USGS column warns of “a high degree of uncertainty” in deposit volumes.
The largest volume is about 5,850 times the 0.1 cubic miles of Mount St. Helens in 1980, and about 49 times the 12 cubic miles of Tambora in 1815, which the 2005 sheet calls the largest eruption on Earth in the past two centuries.
USGS pages do not all give the same ratio. One history page says about 6,000, 700 and 2,500 times St. Helens for the three eruptions, while the 2023 column says about 2,500 times for the oldest and about 1,000 times for the youngest, without stating a baseline. Those lower ratios would fit a St. Helens of about 1 cubic kilometer instead of the sheet's 0.4 of magma. That is our own reading and not a USGS statement.
Two USGS pages let us test the volumes against each other. The history page says the three eruptions together could fill the Grand Canyon, and the column equates 1,000 cubic kilometers with a quarter of that canyon, which would make the canyon 4,000. The three volumes add up to 3,718, or 93 percent of it. Seeing: hazy, because the canyon figure comes from a round equivalence, and the history page counts ash and lava where our sum counts magma.
The same column equates 1,000 cubic kilometers with 400,000 Great Pyramids of Giza. At that rate the largest eruption is about 975,000 of them, and we have a separate sum on what one Great Pyramid is made of.
Yellowstone does not hold the record either. The column lists Toba, about 74,000 years ago, at about 5,300 cubic kilometers, more than twice our working figure.
The word supervolcano has a definition behind it. USGS says the term implies a volcanic center that has erupted more than 1,000 cubic kilometers of material at one time, which is magnitude 8 on the Volcanic Explosivity Index. Measured in magma, Yellowstone's middle eruption falls short of that line at about 280 cubic kilometers, although the threshold counts erupted material, so the two figures are not strictly the same measure.
An eruption of this size also changes the ground. USGS says the first blast removed so much magma that the land above it collapsed into a caldera, a volcanic depression as much as 80 kilometers long and 65 kilometers wide, which is larger than the state of Rhode Island. The 2005 sheet says more than 100 kilometers across.
Is Yellowstone overdue for an eruption?
No. The USGS answer opens with “Yellowstone is not overdue for an eruption,” and the arithmetic behind that answer takes only a few lines.
Step 2: the gaps. The USGS FAQ dates the three large explosions to 2.08 million, 1.3 million and 631,000 years ago, which gives gaps of 780,000 and 669,000 years and an average of 724,500, rounded by USGS to about 725,000.
Since 631,000 years have passed, the average still has about 93,500 years to run, and USGS rounds that to about 100,000. Seeing: hazy, because the dates are USGS's own, but an average of two gaps moves with what you count, as the table below shows.
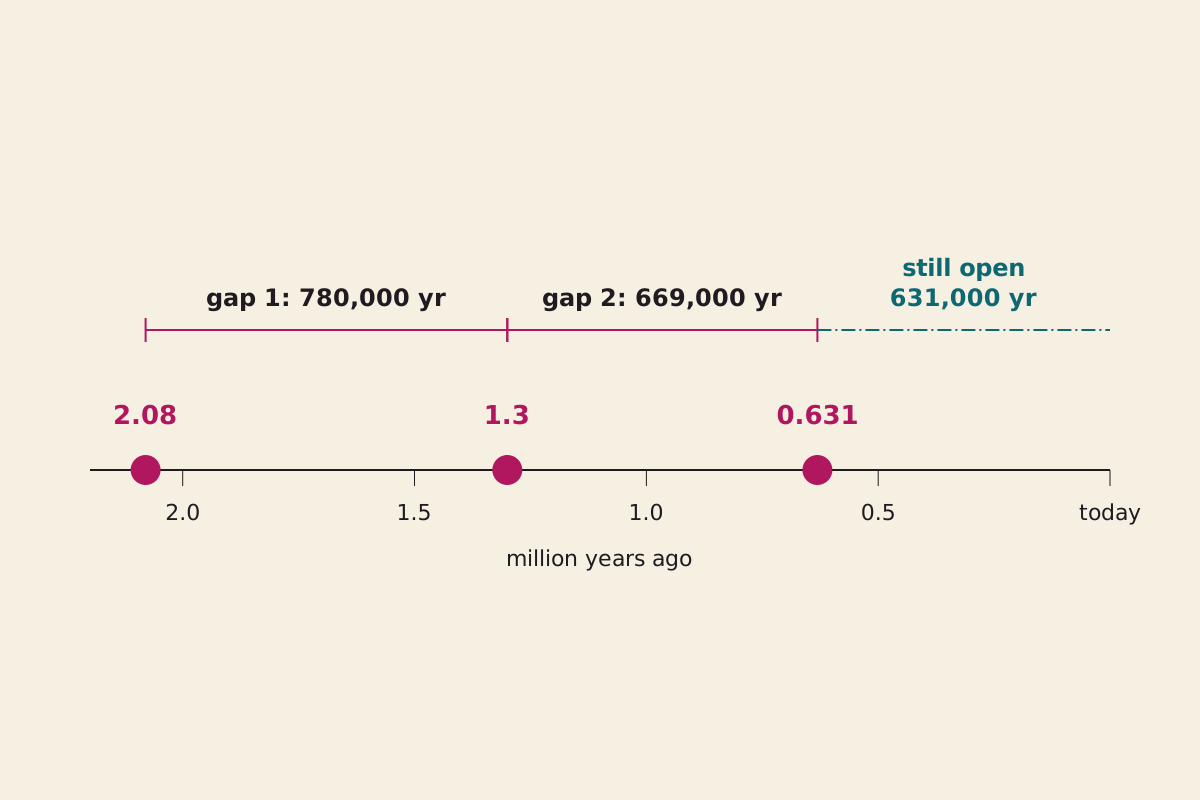
Three dated explosions and the only two gaps they can make. The last stretch is not a gap yet, so it cannot join the average.
"Three Yellowstone eruptions give two gaps" by The What-If Observatory, https://whatifobservatory.com/what-if/yellowstone-eruption/, licensed under CC BY 4.0 (https://creativecommons.org/licenses/by/4.0/)
Data: USGS (eruption dates)
So even on its own terms, the overdue sum fails. USGS does not stop there. It says the figure rests on “just two time intervals” and “is meaningless.” Another USGS page runs the sum with older dates “for those who insist,” gets about 90,000 years to go, and calls a recurrence interval from two values “statistically meaningless.”
Three large eruptions give you two gaps, and you can't call a volcano overdue from two gaps.
The answer also moves with what you choose to count. The table below uses USGS counts and dates throughout, while the sums are ours, and none of them is a forecast. The first two rows average completed gaps. The last two only divide time by a count, so the open stretch since the last event is included.
| What you count | Average spacing | Time since the last one | Same sum says |
|---|---|---|---|
| 3 large explosions, FAQ dates | 724,500 years | 631,000 years | 93,500 years short |
| 3 large explosions, older dates | 730,000 years | 640,000 years | 90,000 years short |
| Probably 15 to 20 caldera eruptions along the hotspot, 16.5 million years ÷ count | 825,000 to 1,100,000 years | 631,000 years | 194,000 to 469,000 years short |
| About 80 smaller eruptions, 631,000 years ÷ count | about 7,900 years | 70,000 years | about 62,000 years late |
That last row is the warning. By the overdue logic, smaller eruptions at Yellowstone would be running at about nine times their average spacing, yet no USGS page we read draws that conclusion, and we do not either. USGS adds that old evidence may be buried or destroyed, so “we do not really know how often the volcano has actually erupted.”
If you want a frequency anyway, the USGS history page gives a recurrence interval of about 600,000 to 800,000 years for the three large eruptions. The 631,000 years since the last one sit inside that range, not past it, and a range drawn from so few events is a description of the past rather than a schedule.
Other USGS statements point the same way. Supereruptions in one system “are not evenly spaced in time,” and most systems that have one do not have several. The shallow magma chamber is only 5 to 15 percent molten, so USGS finds it “unclear if there is even enough magma beneath the caldera to feed an eruption.”
USGS also says it “cannot discount” another one, and the 2005 sheet calls the odds in the next few thousand years “exceedingly low” (pp. 2, 5). Both statements can stand together, because neither one is a date. We give no date either.
How deep would the ash be?
About 30 cm as a layer of magma, if you ignore nearly everything that makes ash fall the way it does. That is the point of doing the simple version first.
Step 3: the area. The Census Bureau's 2010 table gives the US a total area of 9,833,517 square kilometers. Take away Alaska and Hawaii, and the 48 contiguous states and Washington, DC, cover 8,081,867 square kilometers, or 3,120,426 square miles, counting inland, coastal, Great Lakes and territorial water. Seeing: clear.
Step 4: the even layer. Divide 2,438 cubic kilometers by that area, and the layer is 30.2 cm, or about 11.9 inches. Over land alone, it is 31.9 cm. Seeing: hazy, because the inputs are sound and the even spread is plainly false.
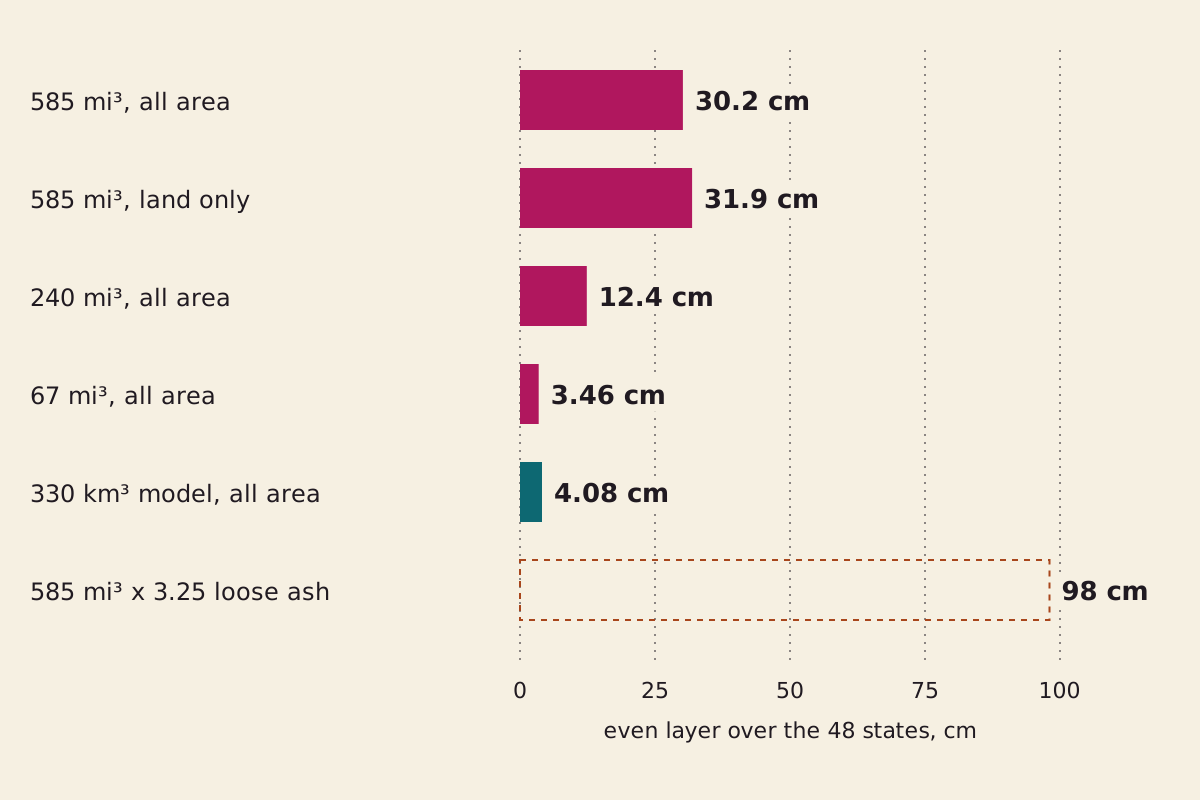
Even layers, each one volume divided by one area. The dashed bar applies the Mount St. Helens loose-ash ratio to all the magma, which shows direction and nothing more.
"Even layers over the 48 contiguous states" by The What-If Observatory, https://whatifobservatory.com/what-if/yellowstone-eruption/, licensed under CC BY 4.0 (https://creativecommons.org/licenses/by/4.0/)
Data: USGS (volumes and ash ratio inputs); US Census Bureau (area); Mastin et al. 2014 (model volume)
Three conditions sit under that 30 cm:
- It counts magma, not ash. Ash takes up more room before it compacts. USGS gives about 1.3 cubic kilometers of ash before compaction for St. Helens, against 0.4 of magma on the sheet, which is 3.25 times by our division. Applied to all of Yellowstone's magma, that one ratio would make the layer about 98 cm. No source we read applies it, so we do not adopt it. Seeing: overcast.
- Not all of it falls as ash. USGS says places closest to the volcano in Montana, Idaho and Wyoming would meet pyroclastic flows, fast currents of hot ash and gas, and those stay near the vent.
- Not all of it lands in the 48 states. USGS says wind carried the lightest particles around the planet.
An average can be correct and still describe no actual place. Our sum on the Moon at half its distance stops at tidal force for a similar reason, since basins and shorelines decide what a coast gets.
Would the ash really fall evenly?
No. The published model we could read runs from millimeters on the coasts to meters in the northern Rockies, about 1,000 times if you read its bands as whole decades.
Step 5: a second road. In 2014, Larry Mastin, Alexa Van Eaton and Jacob Lowenstern ran the Ash3d ash-transport model for a modern eruption lasting 3 days, 1 week or 1 month. Each run produced 330 cubic kilometers of ash, measured as dense rock. We read the USGS record and its abstract rather than the full paper.
Thickness came out at decimeters to meters in the northern Rockies, centimeters to decimeters in the northern Midwest, and millimeters to centimeters on the East, West and Gulf coasts. The model volume is about 14 percent of the largest eruption, and 330 cubic kilometers spread evenly is 4.08 cm of dense rock. The bands measure deposits, and the abstract gives no density to convert one into the other. Seeing: hazy.
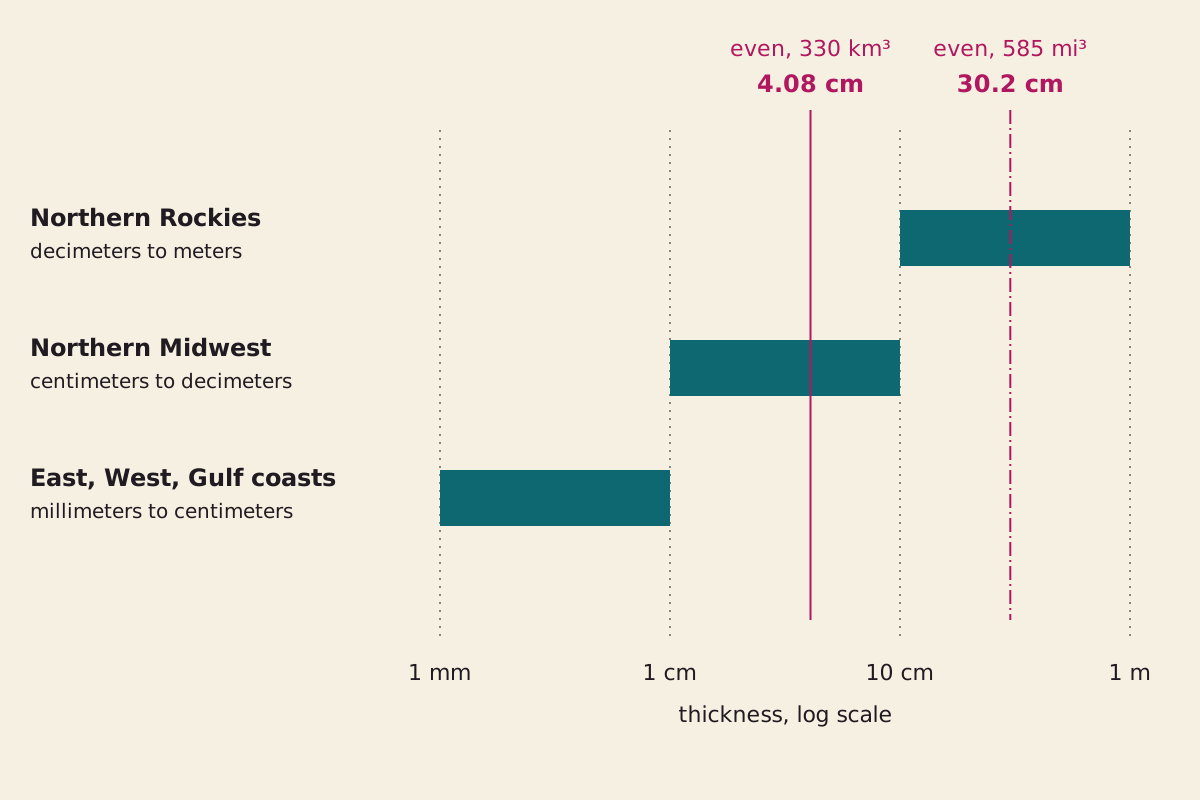
The abstract's three thickness bands, drawn as whole decades. Where each band starts and stops is our reading of its words. The two vertical lines are our even layers of magma and dense rock, not deposits.
"Modeled ash thickness bands against even layers" by The What-If Observatory, https://whatifobservatory.com/what-if/yellowstone-eruption/, licensed under CC BY 4.0 (https://creativecommons.org/licenses/by/4.0/)
Data: Mastin et al. 2014 (bands, as worded in the abstract); USGS (volume); US Census Bureau (area)
Step 6: the gap. Reading the bands as whole decades, the 4.08 cm layer lands inside the Midwest band. It is about 24 times below 1 meter, the top of the Rockies band as we read it, and about 41 times above 1 millimeter, the bottom of the coast band. Both ratios are rough, because they set dense rock against deposits.
We claim two-road agreement, our name for two independent estimates within 3 times of each other, only when the gap is smaller. Here it is not, so the depth at any one place stays Seeing: overcast. The two roads also share something: both assume a caldera-scale eruption from today's Yellowstone, with a volume somebody chose, and the 4.08 cm layer borrows the model's own volume, so this comparison is not fully independent.
The model also shows why the pattern is more than a plume blowing downwind. The abstract says the spreading umbrella cloud can drive ash more than 1,500 kilometers upwind and crosswind, which produces roughly circular bands that the wind only secondarily reshapes. That fits the older deposits, which the 2005 sheet says can still be found as far away as Iowa, Louisiana and California.
The past gives a rough comparison. USGS says the three old eruptions left ash “likely a third of a meter deep several hundred kilometers from Yellowstone” and several centimeters deep farther away.
So our 30 cm sits close to that figure at one distance from the vent, though ours counts magma and theirs counts ash, and it is far above the several centimeters farther out. The model also predicts much less at the far coasts, and USGS says past fallout on the other side of the continent “was minimal.”
Would a Yellowstone eruption wipe out the United States?
The sources we read do not say that. USGS says “even previous Yellowstone supereruptions did not cause extinctions.” It also says a repeat would hit hard: heavy ash fall “would devastate the surrounding area and affected areas downwind,” and even a light dusting can harm people, animals, crops and machinery. The effects would be worldwide, and the amount of ash would fall with distance.
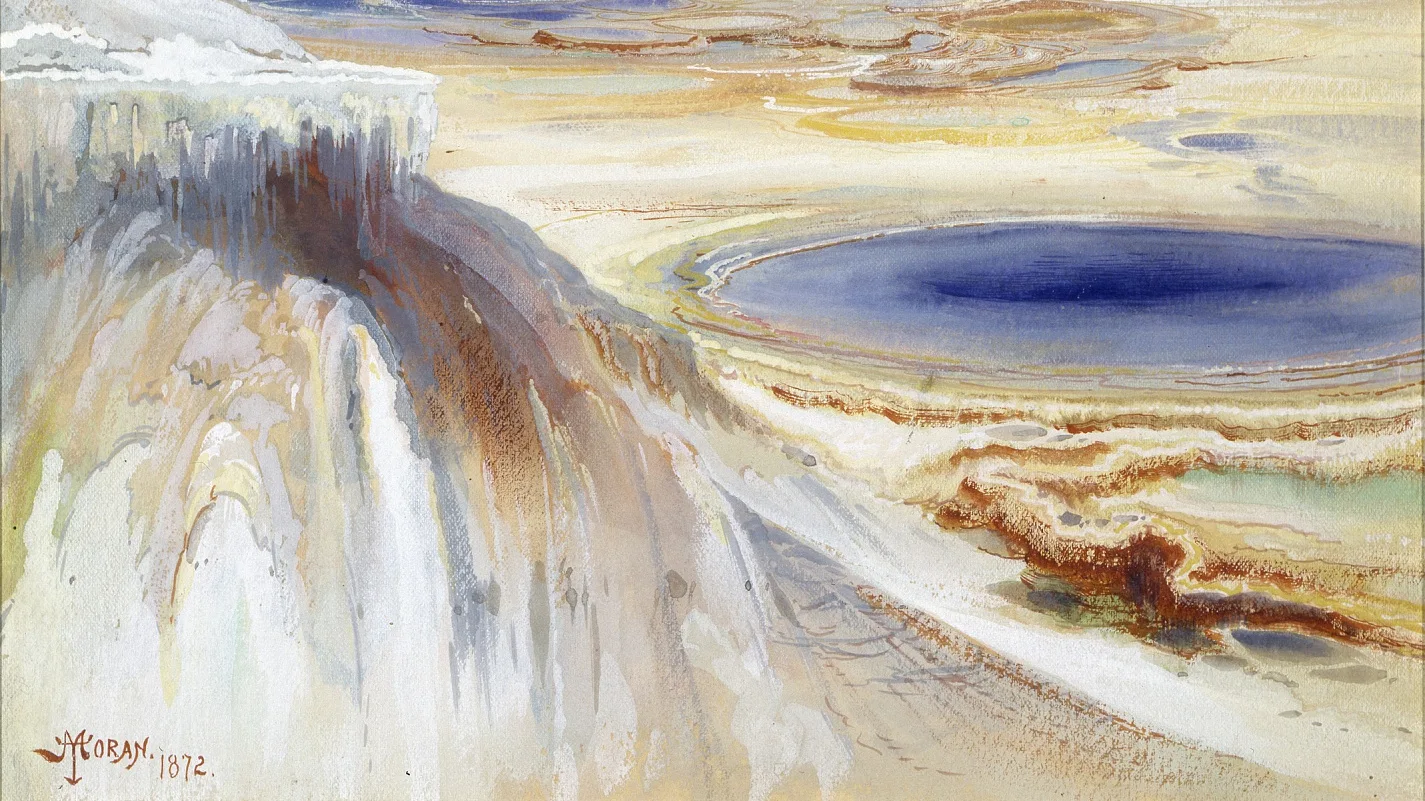
Mammoth Hot Springs, Yellowstone, in watercolor and pencil by Thomas Moran, 1872. It shows hot springs, not an eruption.
Mammoth Hot Springs, Yellowstone, Thomas Moran (Public Domain Mark 1.0)
"Mammoth Hot Springs, Yellowstone" by Thomas Moran — https://commons.wikimedia.org/wiki/File:Mammoth_Hot_Springs,_Yellowstone_SAAM-1958.5.2_1.jpg — Public domain in the US (published before 1931, as the file page states) and in the EU (author died 1926, life+70); modified: cropped to 16:9 from the 1,425 x 2,000 original, crop box (0, 1199, 1425, 2000) in pixels: the lower terraces and pool with the signature and date kept; the upper sheet with the peak and steam removed

Hot springs like these get their heat from the same system, because USGS says the features are fueled by partly molten rock just a few miles down. A place can sit on that heat for a very long time without doing what the headline question asks.
Do earthquakes mean Yellowstone is about to erupt?
Not on their own, since the 2005 sheet says thousands of small quakes are recorded there each year. USGS describes the warning signs of an eruption as strong earthquake swarms and rapid ground movement, typically days to weeks ahead, and says most scientists think the buildup to a catastrophic eruption would be detectable “for weeks and perhaps months to years.”
As of our 2026-11-09 reading, a USGS page says the observatory “has not detected signs of activity that suggest an eruption is imminent.” That page carries no date of its own, so check the source rather than this sentence, because the monitoring with seismographs and GPS instruments goes on after we stop reading.
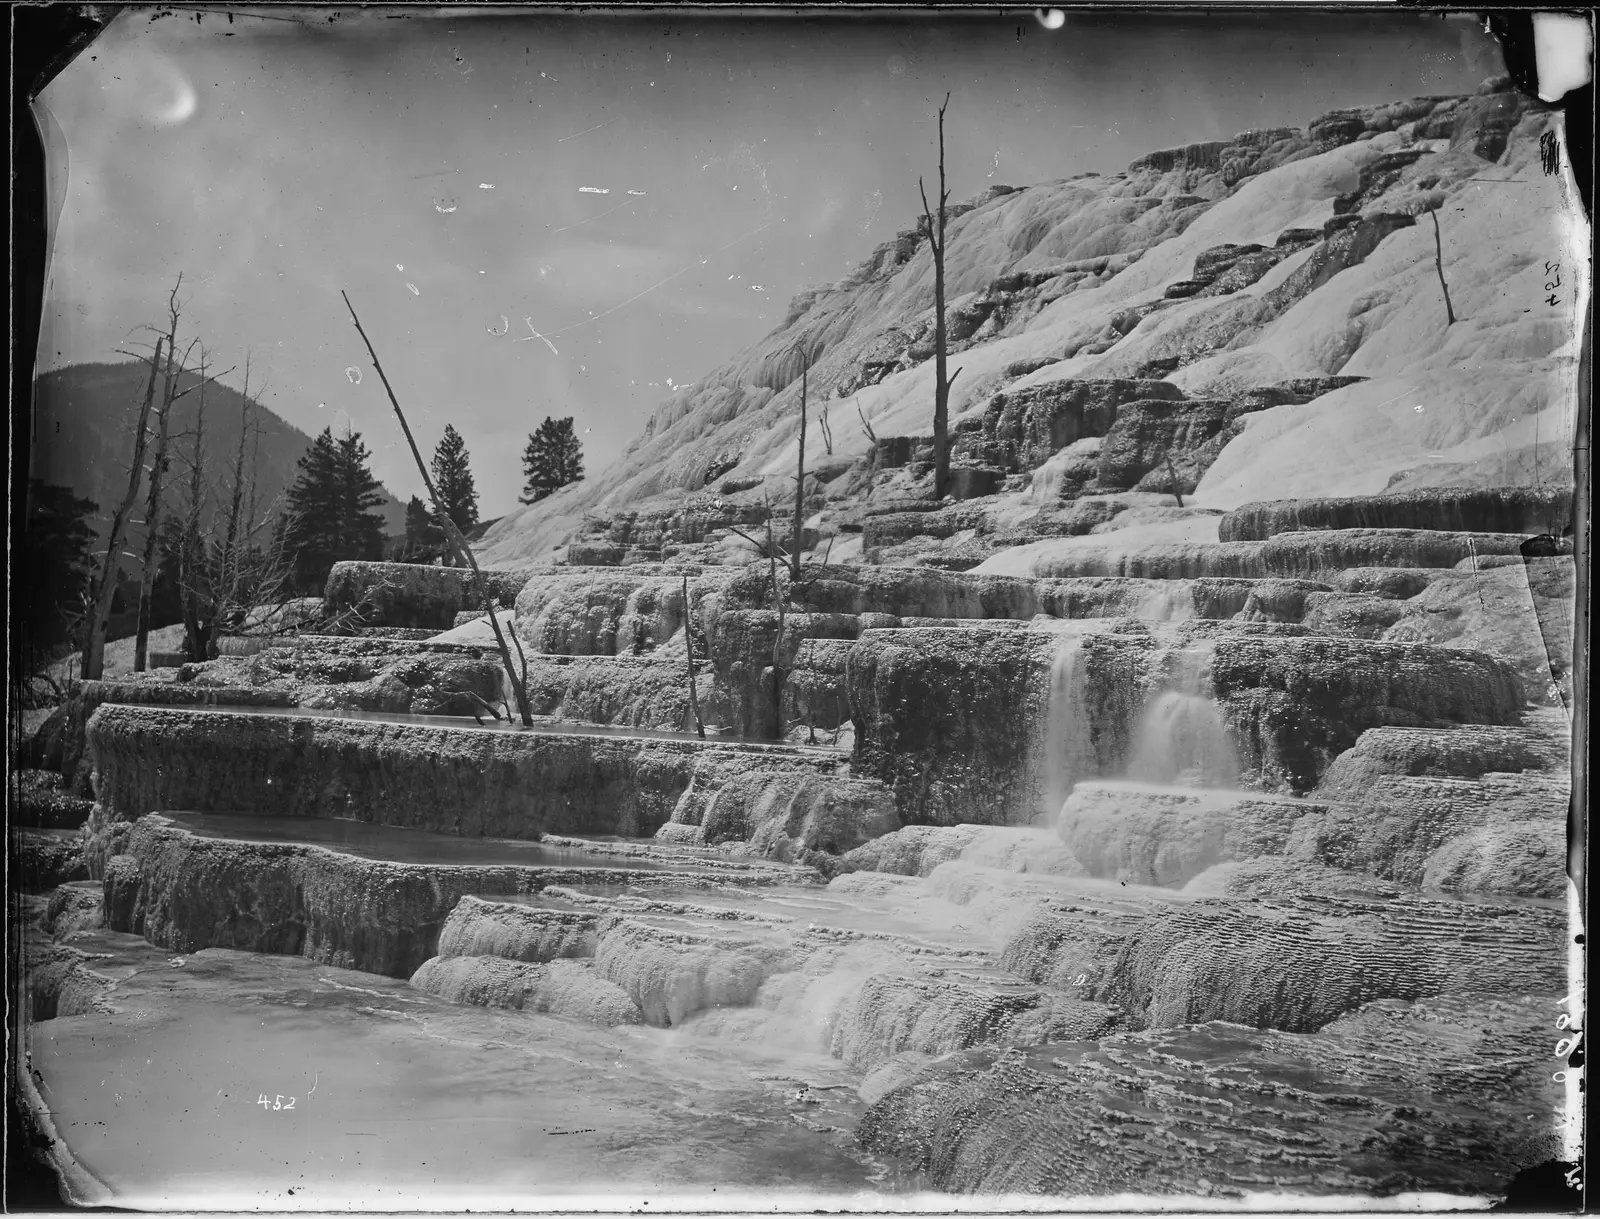
Upper basins on one terrace in Yellowstone, photographed by William Henry Jackson in 1872. The rough edges are kept as scanned. No eruption is shown.
"Group of the upper basins on the same terrace, Yellowstone" by William Henry Jackson — https://commons.wikimedia.org/wiki/File:Group_of_the_upper_basins_on_the_same_terrace,_Yellowstone_-_NARA_-_516807.jpg — Public domain in the US (work of a US government employee, 1872) and in the EU (author died 1942, life+70)

The likelier events are much smaller, which is why our Suppose is the rare case and not the expected one. USGS says the most likely eruption of any kind is a hydrothermal explosion, a rock-hurling geyser eruption, while the most likely volcanic eruption would produce lava flows. If Yellowstone does erupt again, USGS says, “it need not be a large eruption.”
Small hydrothermal explosions happen every few years and leave a crater a few meters across. USGS says one leaves a crater as much as a few hundred meters across every few thousand years, and another USGS page records craters more than a kilometer wide.
The 2005 sheet says none of the large ones in the past 16,000 years was followed by an eruption of magma. Of the past 50 or so eruptions, almost all were simple lava flows, and the most recent was about 70,000 years ago.
Could a Yellowstone eruption change the climate?
Probably, and that is about as far as the sources go. USGS says a caldera-forming eruption “would probably alter global weather patterns” and hurt farming most of all. Its pages give the length three ways: “many years,” “years to decades” and “one-to-two decades.” The same FAQ says scientists “do not have the ability to predict specific consequences or durations.”
Here is the tempting sum. USGS says Pinatubo in 1991 cooled the planet by 0.7 °C at the peak, with cooling that lasted three years. Pinatubo's magma was 487.5 times smaller than the largest Yellowstone volume by the sheet's numbers, or “about 1,000 times smaller” by the FAQ. Multiply, and you get a drop of 341 to 700 °C.
That is not a forecast. It is a broken sum.
Volume is the wrong dial. USGS reports a study by Rampino and Self in 1982: Tambora, Krakatau and Agung cooled the surface by similar amounts, 0.18 to 1.3 °C, though they sent very different amounts of material up. The study pointed to sulfate aerosols, fine particles that stay aloft far longer than ash, which falls out within a few months. We read no figure for the sulfur a Yellowstone repeat would release.
The dotted line falls after step 6. Up to there, every reading has a named source or a stated assumption, and the arithmetic reruns from the table below. Step 7 asks how much sulfur would reach the upper air, how long it would stay and what that would do to harvests, and no source we read puts numbers on those for a repeat. From here on, we are guessing.
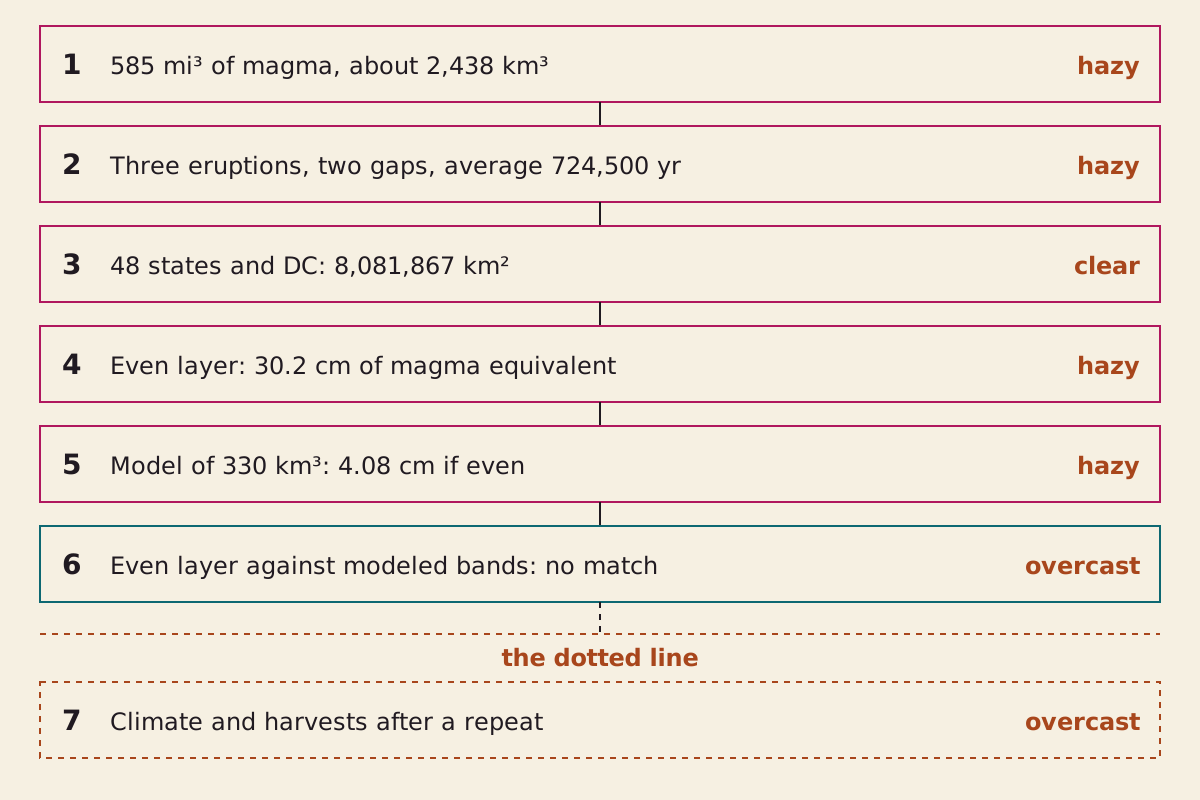
The chain behind this page. Steps 1 to 5 rest on named sources and stated assumptions, step 6 is where the two roads part, and step 7 sits past the dotted line.
"Yellowstone eruption step chain" by The What-If Observatory, https://whatifobservatory.com/what-if/yellowstone-eruption/, licensed under CC BY 4.0 (https://creativecommons.org/licenses/by/4.0/)
So the volume, the two gaps and the even layer sit above that line. The climate and the harvests sit below it. Seeing: overcast.
Check my math:
| Step | Input | Value | Unit | Source no. | Source | Recomputed | Seeing |
|---|---|---|---|---|---|---|---|
| 1 | Largest eruption, magma | 585 | mi³ | 2 | primary | no | hazy |
| 1 | Same volume, exact conversion | 2,438.4 | km³ | 2 | primary | yes | hazy |
| 1 | Against Mount St. Helens: 585 ÷ 0.1 | 5,850 | times | 2 | primary | yes | hazy |
| 1 | Against Tambora: 585 ÷ 12 | 48.75 | times | 2 | primary | yes | hazy |
| 1 | Three eruptions added | 3,718 | km³ | 2 | primary | yes | hazy |
| 1 | Grand Canyon implied: 1,000 ÷ 1/4 | 4,000 | km³ | 5 | primary | yes | hazy |
| 1 | Three eruptions as a share of it | 0.93 | ratio | 2, 3, 5 | primary | yes | hazy |
| 1 | Largest eruption in Great Pyramids | 975,355 | pyramids | 2, 5 | secondary | yes | hazy |
| 2 | First gap: 2.08 − 1.3 Myr | 780,000 | yr | 1 | primary | yes | clear |
| 2 | Second gap: 1.3 − 0.631 Myr | 669,000 | yr | 1 | primary | yes | clear |
| 2 | Average of the two gaps | 724,500 | yr | 1 | primary | yes | hazy |
| 2 | Average minus time since the last | 93,500 | yr | 1 | primary | yes | hazy |
| 2 | Same sum, older dates | 90,000 | yr | 4 | primary | yes | hazy |
| 3 | 48 states and DC, total area | 8,081,867 | km² | 6 | primary | yes | clear |
| 4 | Even layer, all area | 30.2 | cm | 2, 6 | site assumption | yes | hazy |
| 4 | Same layer in inches | 11.9 | in | 2, 6 | site assumption | yes | hazy |
| 4 | Even layer, land only | 31.9 | cm | 2, 6 | site assumption | yes | hazy |
| 4 | Loose ash per magma, St. Helens | 3.25 | ratio | 2, 8 | primary | yes | overcast |
| 4 | Layer if that ratio applied to all magma | 98 | cm | 2, 6, 8 | site assumption | yes | overcast |
| 5 | Modeled eruption volume | 330 | km³ DRE | 7 | primary | no | hazy |
| 5 | Modeled volume as a share of the largest | 0.135 | ratio | 2, 7 | site assumption | yes | hazy |
| 5 | Modeled volume spread evenly | 4.08 | cm | 6, 7 | site assumption | yes | hazy |
| 6 | Top of the Rockies band ÷ that layer | 24.5 | times | 6, 7 | site assumption | yes | overcast |
| 6 | That layer ÷ bottom of the coast band | 40.8 | times | 6, 7 | site assumption | yes | overcast |
| 7 | Pinatubo cooling × fact-sheet magma ratio | 341 | °C | 2, 11 | site assumption | yes | overcast |
| 7 | Climate and harvests after a repeat | — | — | 11, 12 | secondary | no | overcast |
Download yellowstone-check-my-math.csv (where its values come from)
Download yellowstone-eruptions.csv (where its values come from)
Cubic miles convert at 4.16818 cubic kilometers, and the worked figures in the text were compared with the CSV. Where a USGS page rounds a figure, the text says so.
Next question:
- What if the Sun repeated 1859? The Carrington event
- How many blocks did one pyramid take? The Great Pyramid count
Sources
- U.S. Geological Survey. “Is Yellowstone overdue for an eruption? When will Yellowstone erupt?” FAQ. Original Read: full answer; the supervolcano threshold from the related-question summary on the same page; last read 2026-11-08.
- Jacob B. Lowenstern, Robert L. Christiansen, Robert B. Smith, Lisa A. Morgan, Henry Heasler (2005). “Steam Explosions, Earthquakes, and Volcanic Eruptions: What's in Yellowstone's Future?” USGS Fact Sheet 2005-3024. Original Read: full text; page 5 diagram viewed.
- U.S. Geological Survey, Yellowstone Volcano Observatory. “Questions About Yellowstone Volcanic History.” Original Read: full page, last read 2026-11-08.
- U.S. Geological Survey, Yellowstone Volcano Observatory. “Questions About Future Volcanic Activity at Yellowstone.” Original Read: full page.
- Yellowstone Volcano Observatory. “In the pantheon of caldera eruptions, where does Yellowstone rank?” Yellowstone Caldera Chronicles, U.S. Geological Survey, July 3, 2023. Original Read: full column, last read 2026-11-08.
- U.S. Census Bureau. “State Area Measurements and Internal Point Coordinates.” Reference files, 2010. Original Read: single values from the state table: United States, Alaska and Hawaii rows.
- Larry G. Mastin, Alexa R. Van Eaton, Jacob B. Lowenstern (2014). “Modeling ash fall distribution from a Yellowstone supereruption.” Geochemistry, Geophysics, Geosystems 15(8):3459–3475. doi:10.1002/2014GC005469. Original Read: abstract only, in the USGS publication record.
- U.S. Geological Survey. “How far would ash travel if Yellowstone had a large explosive eruption?” FAQ. Original Read: full answer; the Mount St. Helens figures from the related-question summary on the same page.
- U.S. Geological Survey. “What type of eruption will Yellowstone have if it erupts again?” FAQ. Original Read: full answer; forecasting wording from the related-question summary on the same page; last read 2026-11-08.
- U.S. Geological Survey. “What would happen if a ‘supervolcano’ eruption occurred again at Yellowstone?” FAQ. Original Read: full answer.
- U.S. Geological Survey. “Could a large Yellowstone eruption significantly change the climate?” FAQ. Original Read: full answer.
- U.S. Geological Survey. “Climate Change Potential as a Result of a Large Eruption of Yellowstone.” Original Read: full page; Rampino and Self 1982 only as this page reports it.
Cite this page
The What-If Observatory. "What If a Yellowstone Eruption Repeated? USGS: Not ‘Overdue’." Published 2026-11-09. https://whatifobservatory.com/what-if/yellowstone-eruption/. Add the date you read it.
Corrections
None so far.