What If a Carrington Event Hit Today? The Size Is Disputed
The What-If Observatory Published
On September 1, 1859, Richard Carrington was watching sunspots when he saw a very bright solar flare. Published readings of the magnetic storm that followed give about −1,760 nanoteslas (nT, a unit of magnetic disturbance) as a spot value, which a 2022 review doubts, but −850 to −1,050 nT in hourly averages. Both lean on one observatory, and together they run roughly 1.4 to 3 times the March 1989 storm. With that spread, and a grid that answers to more than storm size, no single damage figure holds up here.
Steps in this reading (8)
- What did Carrington see?
- How strong was the Carrington event?
- Could a Carrington event happen again?
- How far from the poles did the aurora reach?
- What did the Carrington event do to telegraphs?
- What would a Carrington event do to the power grid?
- Would a Carrington event break a phone?
- What would a Carrington event cost today?
- Check my math
- Suppose:
- the Sun repeats September 1859 this year.
- Hold fixed:
- the published storm-size range; no specific grid model.
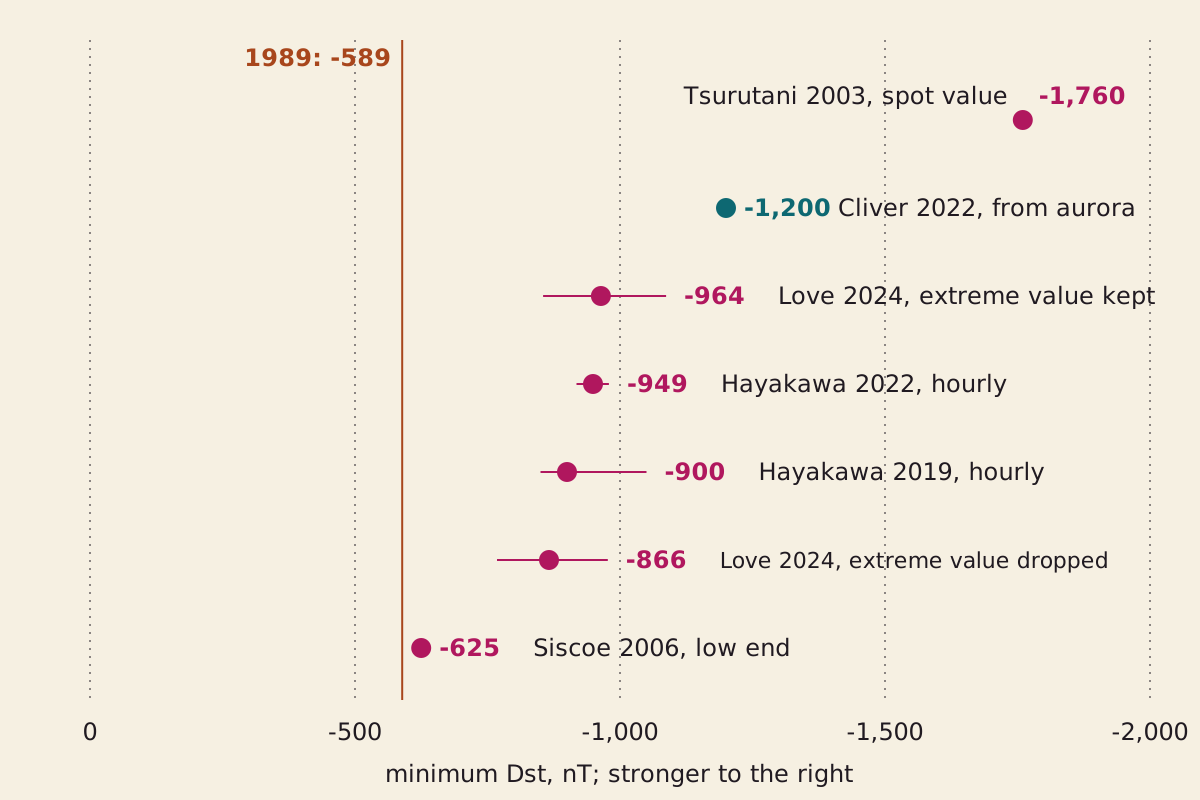
Published readings of the 1859 storm. Horizontal bars show each study's stated range, and the vertical line marks March 1989. The −1,200 nT reading comes from aurora reports and a formula fitted to later storms, the others from magnetometer records.
"Published readings of the September 1859 storm" by The What-If Observatory, https://whatifobservatory.com/what-if/carrington-event/, licensed under CC BY 4.0 (https://creativecommons.org/licenses/by/4.0/)
Data: Hayakawa et al. 2019 and 2022; Love et al. 2024; Cliver et al. 2022 (CC BY 4.0)
What did Carrington see?
A flare, and a brief one. A 2022 review by Edward Cliver and colleagues calls it his discovery of the first solar flare on record, seen from his observatory in Reigate, south of London, and its table times the flare at 11:18 in world time (UT). Richard Hodgson saw it independently from Highgate. Never look at the Sun without proper eye protection; this page is about the record and is not a viewing guide.
Carrington's own 1859 paper in Monthly Notices is out of our reach, so this comes as the review's introduction quotes it. He “hastily ran to call someone to witness the exhibition with me,” and within 60 seconds found it “already much changed and enfeebled.” He also would not tie it to the magnetic disturbance: “One swallow does not make a summer” (sec. 1).
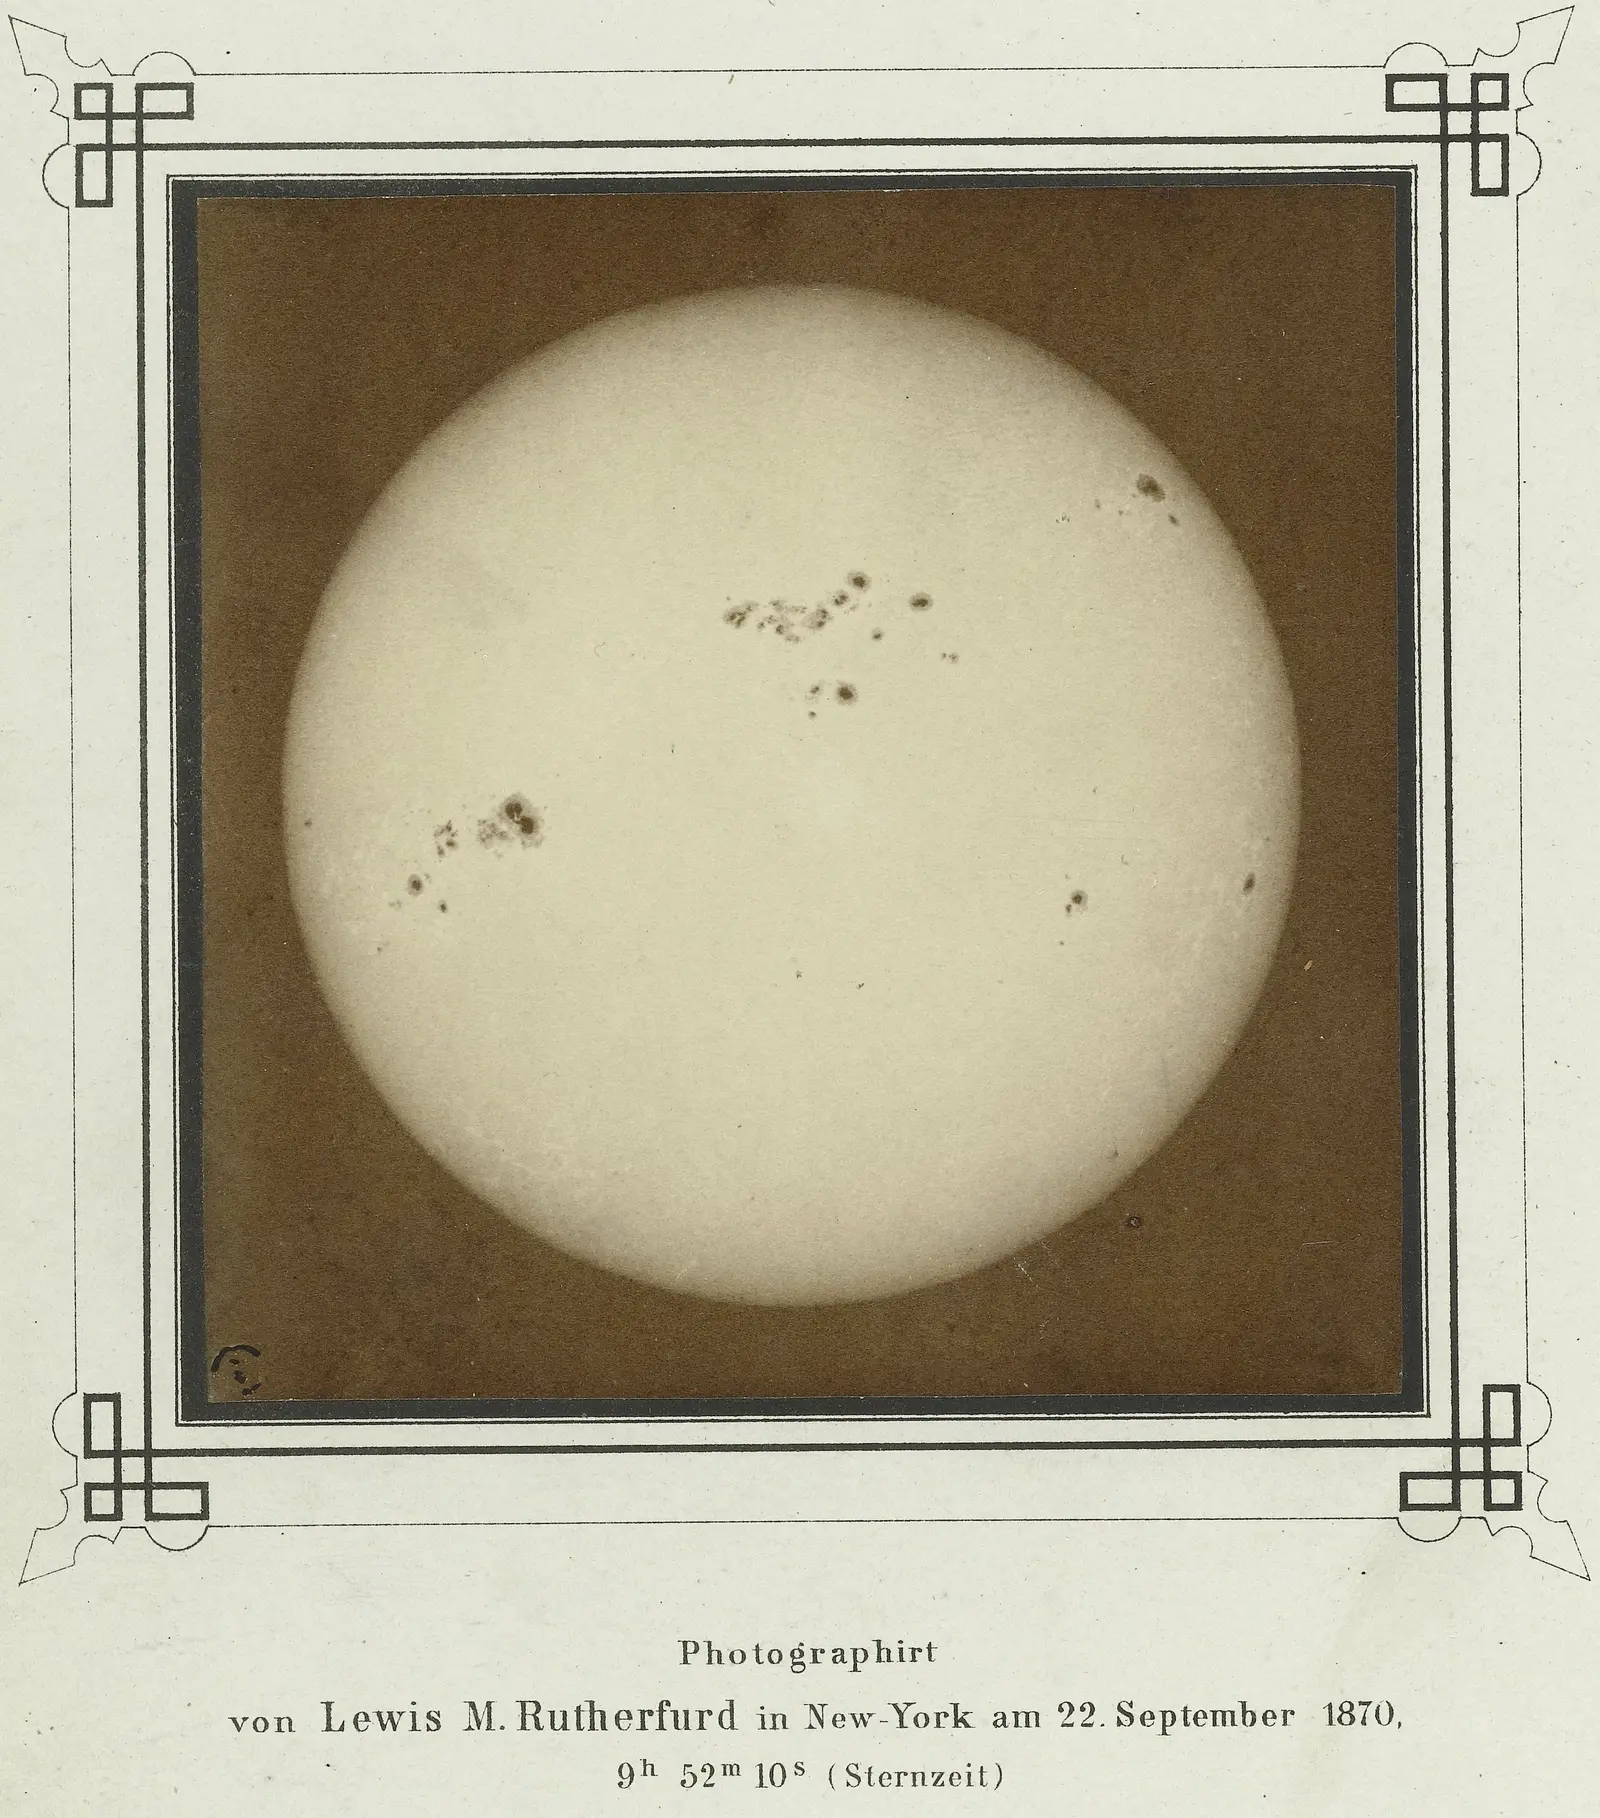
The Sun and its sunspots, photographed by Lewis M. Rutherfurd in New York on September 22, 1870. This is not the Sun of 1859, and the printed caption keeps its own date.
"Gezicht op de Maan. Photographie directe de la lune" by Lewis M. Rutherfurd — https://commons.wikimedia.org/wiki/File:Gezicht_op_de_Maan_Photographie_directe_de_la_lune_(titel_op_object),_RP-F-2001-7-30-1.jpg — Public domain in the US (published before 1931) and in the EU (author died 1892, life+70); modified: cropped from a photograph of the book page to the printed frame and caption

Step 1: the crossing. A 2022 paper led by Hisashi Hayakawa puts the peak of the storm's onset at 04:20 UT on September 2 and the crossing at no more than 17.1 hours, counting from a flare time of 11:15 UT, which we get as 17.08. From the review's 11:18, we get it as 17.03. The paper gives an average speed of at least 2,430 km/s. At that speed, the 384,402 km to the Moon takes about 158 seconds.
The date is firm, but the speed is only a straight average. Seeing: hazy. Seeing is a label from astronomy for how well the air lets you make out detail, and here it rates how much weight a step can bear.
How strong was the Carrington event?
Recent hourly work puts it near −950 nT, about 1.6 times March 1989. The highest figure we read is about 3 times, and the review doubts it.
The scale is the Dst index, a measure of how far a storm pushes down Earth's magnetic field. By definition it comes from hourly averages at four stations, and in 1859 there was nothing like that: the numbers lean on one observatory, Colaba in Bombay, where readings were taken by hand.
Step 2: the readings. All of these are given as minimum Dst values or a close stand-in, and the yardstick is −589 nT, which the 2022 review gives as the lowest observed in modern times, in March 1989.
- −1,760 nT, a spot value from Tsurutani and colleagues in 2003. It is about 2.99 times 1989, which matches the “three times” claim the review reports and then calls “likely an overestimate” (sec. 1).
- −850 to −1,050 nT, the hourly range. Hayakawa's 2019 paper writes it as −900 (+50, −150) and says this better represents Dst, while noting it is still one station.
- −918, −979 and −949 nT, three scenarios from the 1859 Colaba yearbook, which Hayakawa's team located. Their 2022 paper says this measure roughly approximates minimum Dst.
- −964 nT, a median from Jeffrey Love and colleagues in 2024, with a 68 percent interval of −855 to −1,087 nT. Drop the most extreme Colaba value and it becomes −866 nT, with −768 to −977 nT. We read the USGS record and abstract, not the full paper.
- −625 nT, the low end as the review gives it for Siscoe and colleagues in 2006. The same review also gives −850 nT for that study.
The spot value is 1.68 to 2.07 times the hourly range. That gap is not two independent roads, since both sides come from the same observatory. The labels are also less tidy than they sound.
In the yearbook, the peak change in the horizontal field at Colaba reads −1,263 nT in the spot table and −1,691 nT in the hourly table, so the hourly figure is the larger one. The paper notes that those hourly tables hold readings taken on the hour, not averages, and the 2022 review lists −1,760 among hourly estimates. Those are local changes and not Dst, so they do not replace the list above.
Love's team found that only about one in a million storms of this size should produce a local swing beyond the Colaba report, and concluded either that other currents were involved or that “there might be something wrong with the Colaba data.”
There is a second road, and it uses no 1859 magnetometer reading. The review relates the lowest overhead aurora to storm size and gets about −1,200 nT for 1859, and it calls results from this method “suggestive rather than definitive” (sec. 6.2). The formula was fitted to storms no stronger than −350 nT, so this is a long stretch past its data. On six later storms it missed the magnetometer value by as much as 1.83 times, by our division.
Against −949 nT, the aurora figure is 1.26 times, inside two-road agreement, our name for two estimates from different main inputs within 3 times of each other. That gap is smaller than the formula's own worst miss. So the roads are consistent, and that is about all it shows.
Both roads share an assumption: that a few low-latitude signals can stand for one worldwide storm. So the size gets Seeing: hazy, and no better.
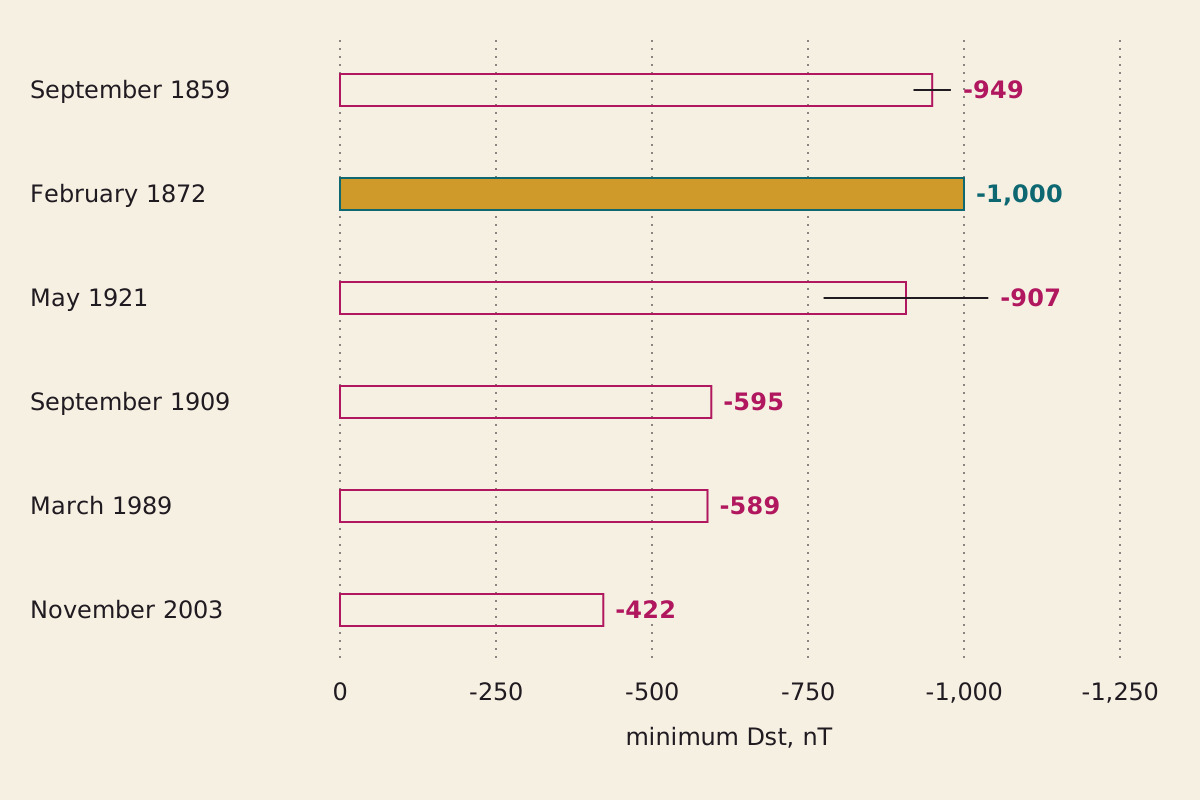
Six storms on one scale. The 1859 and 1921 bars carry their stated errors, and the filled 1872 bar is a conservative value and not a computed index.
"Great magnetic storms by minimum Dst" by The What-If Observatory, https://whatifobservatory.com/what-if/carrington-event/, licensed under CC BY 4.0 (https://creativecommons.org/licenses/by/4.0/)
Data: Cliver et al. 2022 (CC BY 4.0); Hayakawa et al. 2019
Ranking also depends on what you measure. A 2024 review led by Bruce Tsurutani, whose 2003 paper produced the top figure, says the long 1989 storm was “probably greater than the Carrington storm in the sense that the total ring current particle energy was larger.” We read that abstract only. By peak Dst the order flips back.
Could a Carrington event happen again?
Storms in this range already have. The review gives May 1921 at −907 nT, with an error of 132, and February 1872 at a conservative −1,000 nT. Hayakawa's 2019 paper calls the 1859 event “likely not unique.”
Step 3: how often. The review tabulates fits for a storm of −850 nT, with waiting times from 49 to 333 years and a printed median of 93. A separate fit for −1,760 nT gives 159 years, inside that range, because the methods and data differ. The spread is 6.8 times, well past our 3-times limit. Seeing: overcast.
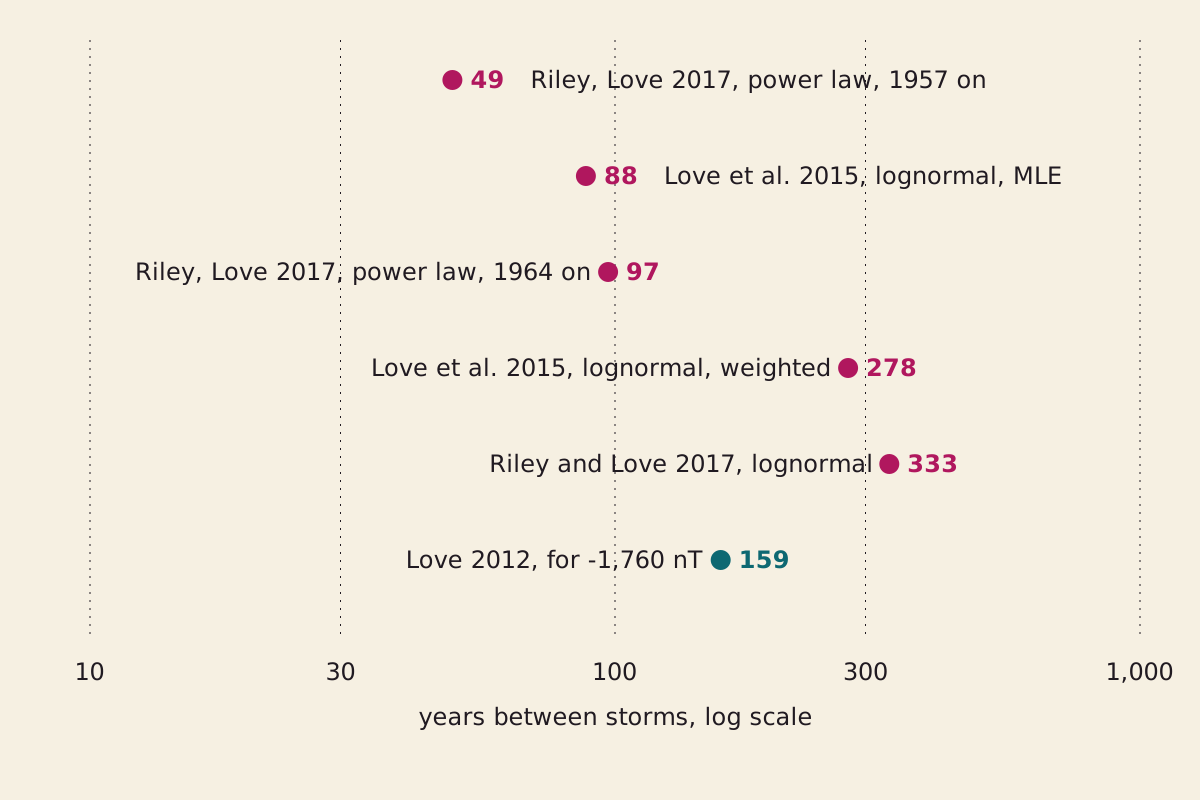
Waiting times as tabulated in the 2022 review. Each dot is one statistical fit, on a log scale where each major gridline is about three times the last.
"Waiting times for a storm of Carrington size" by The What-If Observatory, https://whatifobservatory.com/what-if/carrington-event/, licensed under CC BY 4.0 (https://creativecommons.org/licenses/by/4.0/)
Data: Cliver et al. 2022, Table 6 (CC BY 4.0)
Love's team says the widths of their intervals make occurrence estimates “very uncertain.” USGS adds that a superstorm is more probable around solar maximum, when sunspots are numerous. A waiting time still is not a due date, the same trap we found at Yellowstone, and we give no date either.
How far from the poles did the aurora reach?
To about 21 degrees of magnetic latitude, measured from the magnetic equator, by one count, and to about 17 by a later one. Hayakawa's 2019 paper places the September reports at about 20.5 or 21.8 degrees, depending on how one Honolulu report is dated, and lists sightings along the Caribbean coast, down to about 22.8 degrees, and at Santiago, Chile, about 22 degrees south.
The 2022 review's table goes to 17.3 degrees south, from a ship named Dart. The August storm reached about 20.2 degrees. Seeing: hazy, because observers had to judge what they saw.
The review warns that old records can confuse aurora with “a forest fire, a comet, zodiacal light, or an atmospheric optical effect” (sec. 6.2). It also says sightings depend on weather, on where observers lived and, more recently, on light pollution. An 1879 book by J. Rand Capron repeats a broader list: Rome, Cuba, the West Indies and Melbourne.
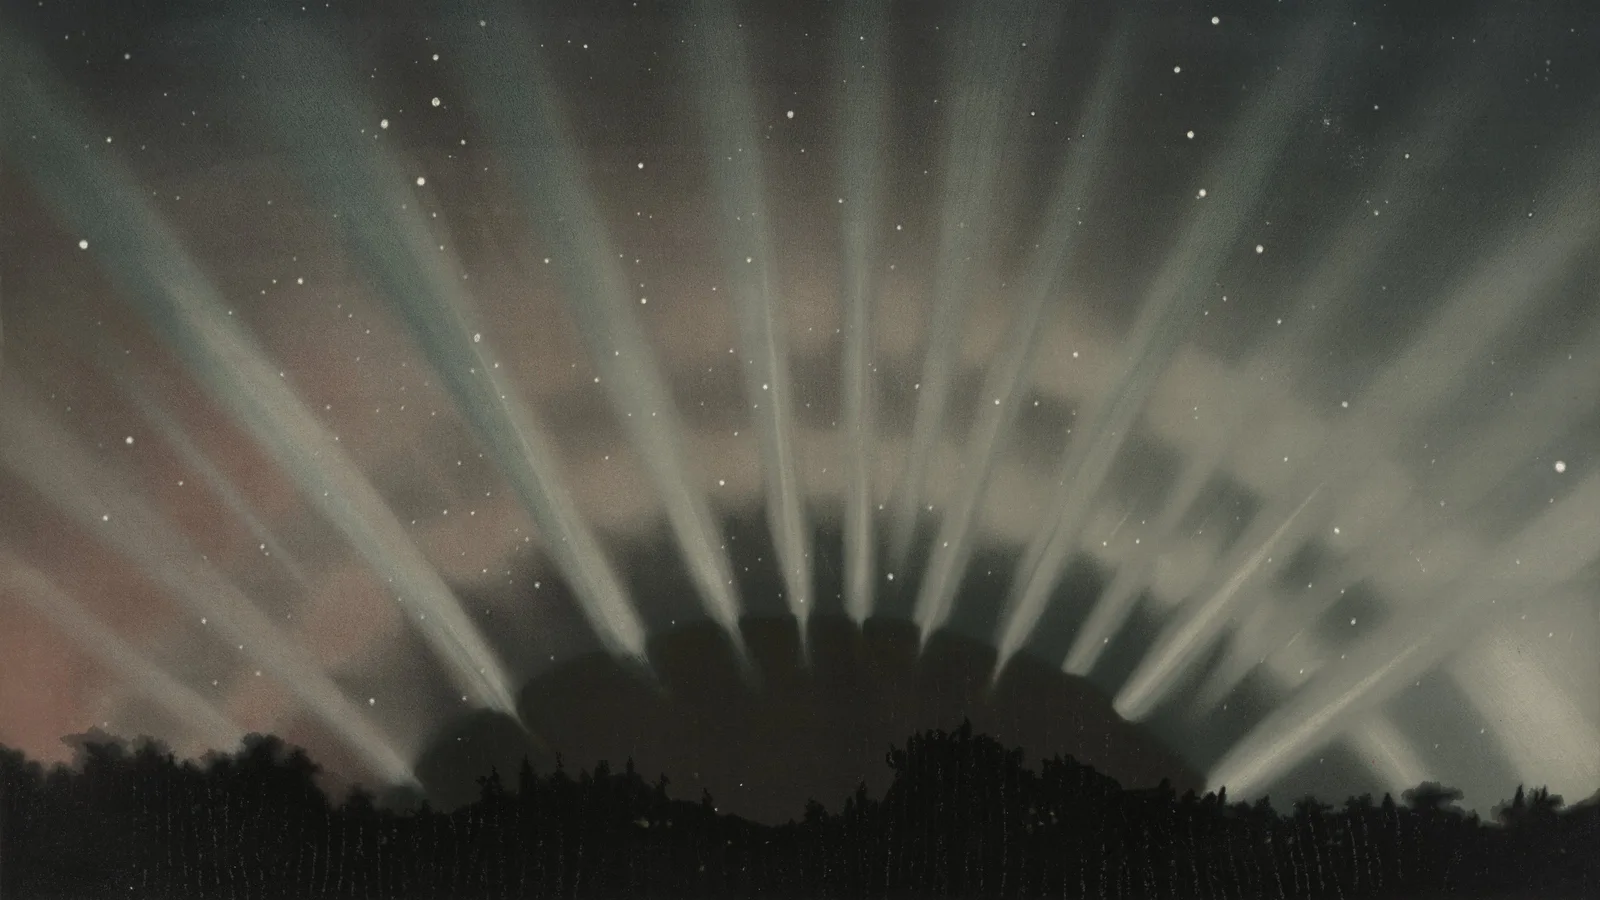
Aurora borealis as É. L. Trouvelot observed it on March 1, 1872, printed in 1881. It is not the aurora of 1859, for which we use no picture.
"Aurora Borealis (Plate IV, The Trouvelot Astronomical Drawings)" by É. L. Trouvelot — https://commons.wikimedia.org/wiki/File:Trouvelot_-_Aurora_Borealis_-_1872.jpg — Public domain in the US (published 1881) and in the EU (author died 1895, life+70); modified: cropped to 16:9, keeping the rays and the treeline; plate margins and printed title and date line removed

What did the Carrington event do to telegraphs?
It stopped them and, for a few hours, ran them. The best account we read is an unsigned article in The Atlantic Monthly for December 1859, written within months of the storms. It covers two: Sunday, August 28, and the morning of September 2.
On August 28, it says, the lines across the northern United States and Canada “were rendered useless for all business purposes,” even circuits of only twelve miles.
Step 4: the wires. The Canadian superintendent O. S. Wood reports skilled operators working from eight o'clock until one o'clock to pass about four hundred words, and then closing the line. That is about 80 words an hour, one word every 45 seconds or so, by our division. The same article explains why: the current came in waves of about fifteen seconds, sometimes a full minute, and business had to fit in gaps of a quarter to half a minute.
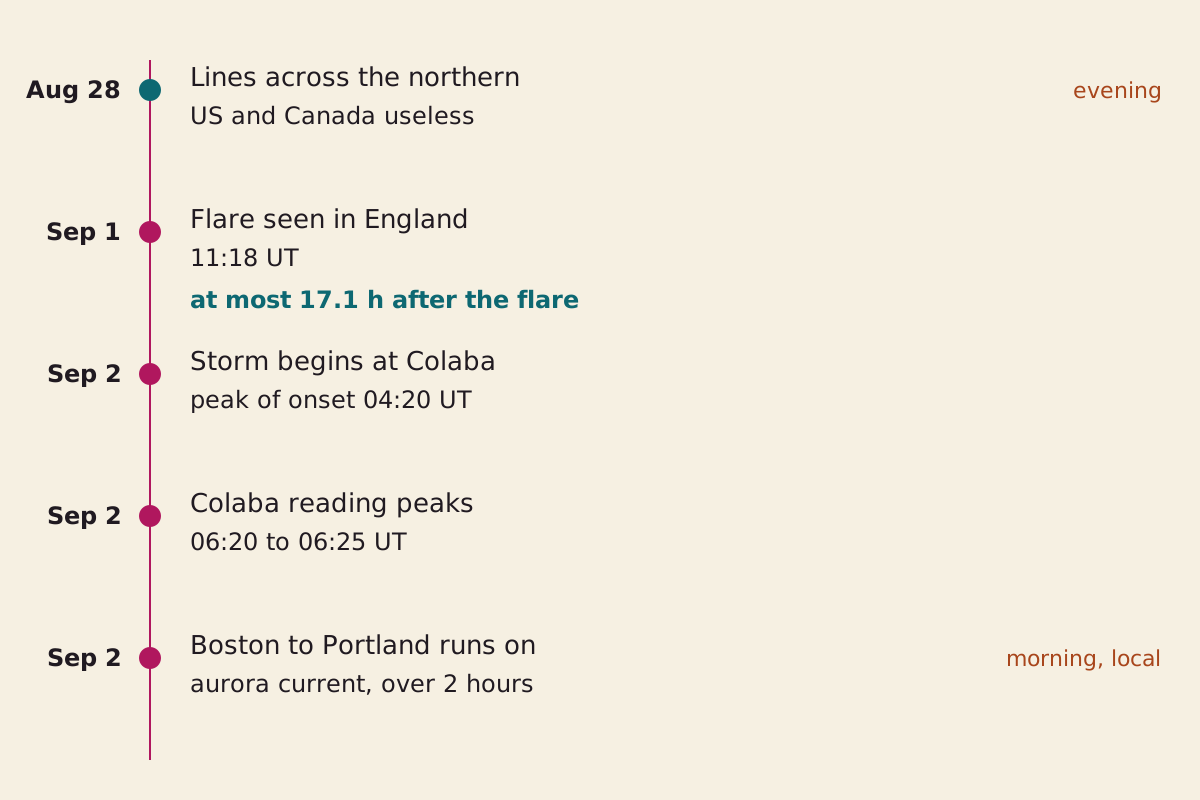
Two storms in five days. The Boston to Portland hours are local time in the source, and the other September times are world time.
"August and September 1859" by The What-If Observatory, https://whatifobservatory.com/what-if/carrington-event/, licensed under CC BY 4.0 (https://creativecommons.org/licenses/by/4.0/)
Data: The Atlantic Monthly, December 1859; Cliver et al. 2022 (CC BY 4.0); Hayakawa et al. 2022
For September 2, the same article reports something odder. Boston and Portland could not work with their batteries on, so the Boston operator wrote: “Please cut off your battery, and let us see if we cannot work with the auroral current alone.” They did, for more than two hours, on the storm's own current.
Fire is the other story. A 2024 USGS fact sheet says the storm “caused fires at numerous telegraph stations around the world,” while a 2018 USGS page says “some.” Capron, twenty years later, retells severe shocks to clerks at Washington and Philadelphia, a transmitting apparatus set on fire in Norway, and flame following the pen at Boston.
The disruption itself, told by the people working the lines, gets Seeing: clear. The run on aurora current rests on one unsigned account, and Capron's details are a retelling, so those get Seeing: hazy.
USGS gives the reason a telegraph is the right comparison: those systems relied on “long-grounded networks of wires (like power grids of today).”
What would a Carrington event do to the power grid?
If many transformers were damaged, USGS says, the result could be “prolonged loss of electric power across a broad region of the United States,” but no source we read turns a storm size into a count of what fails. The physics is simple enough to rerun.
Step 5: the voltage. USGS says some storms have induced more than 10 volts per kilometer over electrically resistive rock. Along a 100 km line, that adds up to 1,000 volts. Those voltages push currents through the grounding points at transformer substations, and USGS says they can “interfere with grid operation and even damage or destroy transformers.” The sum reruns, but the field along any real line is what moves it. Seeing: hazy.
It has happened at a smaller size. In March 1989, at −589 nT, such currents “led to the complete collapse of the Hydro-Québec electric power grid.” In October 2003, a National Weather Service assessment reports the Swedish utility group Sydkraft describing transformer problems, a system failure and a blackout. An excerpt in the same report has a Sydkraft official saying the storm was not fully identified as the cause.
Try multiplying. If −589 nT brought down one grid, then 3 times that brings down three grids, or something like it.
That sum does not work, and the review says why: storm strength and induced current “are not closely related” (sec. 6).
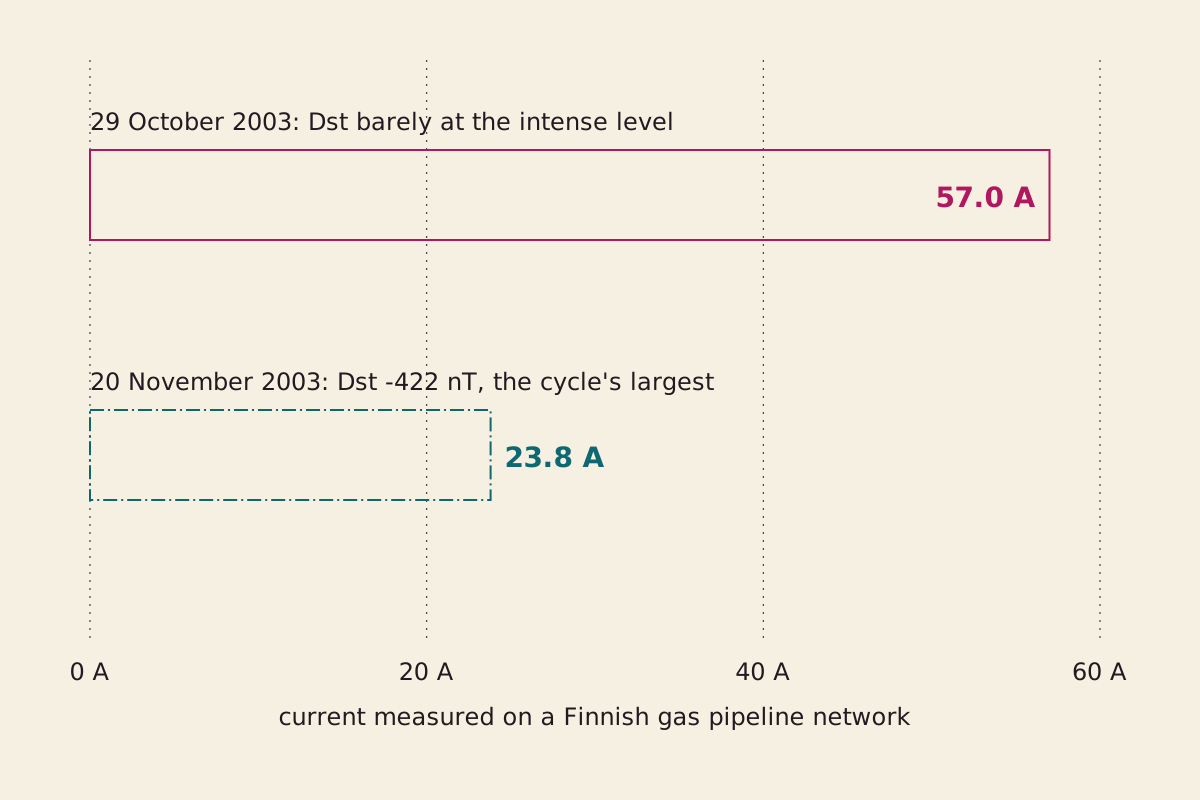
Two storms from the same autumn on the same pipeline network. The larger current, about 2.4 times the other, came while Dst was barely at the intense level. A pipeline is not a grid, but the current comes from the same kind of field.
"The stronger storm drew less current" by The What-If Observatory, https://whatifobservatory.com/what-if/carrington-event/, licensed under CC BY 4.0 (https://creativecommons.org/licenses/by/4.0/)
Data: Huttunen et al. 2008, as quoted by Cliver et al. 2022 (CC BY 4.0)
The review's example comes from Finland in 2003. The largest current on a gas pipeline network, 57.0 amperes, came on October 29, when Dst was barely at the intense level, while the largest Dst storm of that cycle, −422 nT on November 20, drew 23.8 amperes. USGS adds that the field depends on how fast the magnetism changes and on the rock underneath.
That is the second reason the disputed number cannot do the job. Settle it at −949 or −1,760 and you still have not said what any line would carry.
Would a Carrington event break a phone?
No source we read says it would, and the sum gives a reason to doubt it. These hazards attach to long grounded wires.
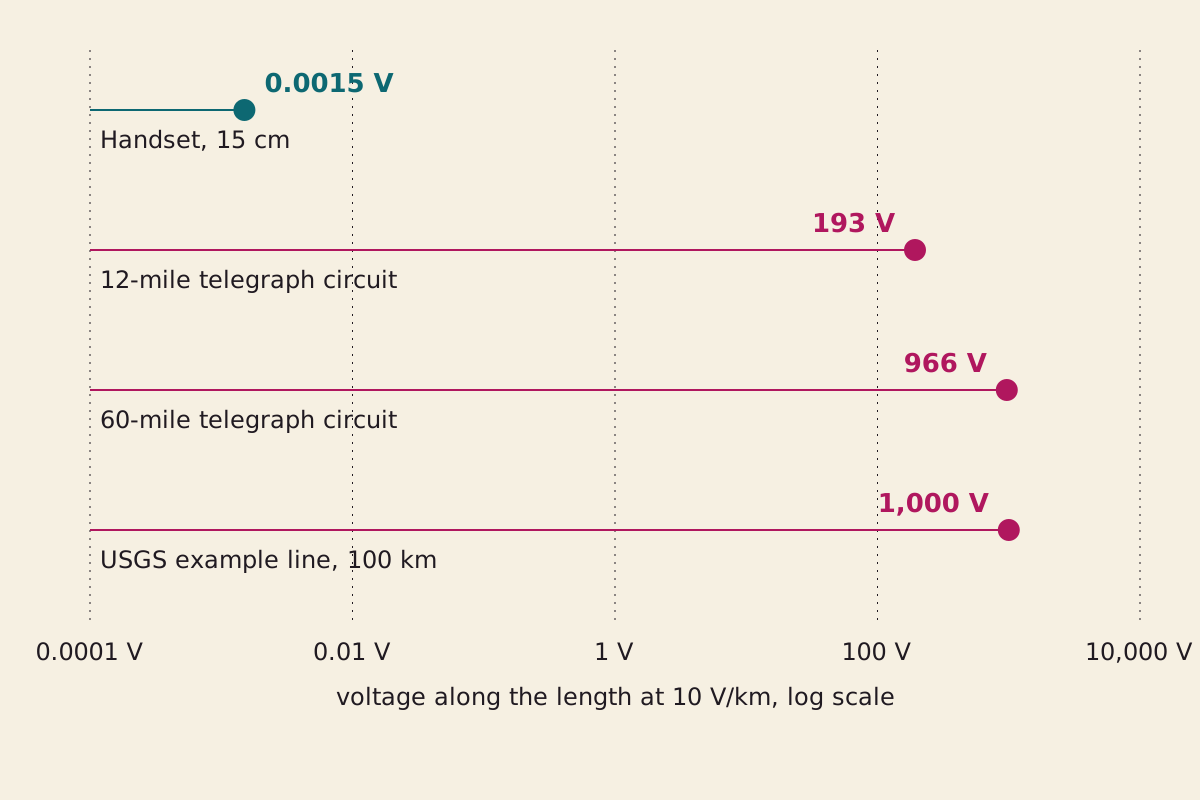
One field, four lengths, on a log scale. The 10 V/km figure is modern, so the two telegraph rows only show the effect of length. The field of 1859 is not known.
"Same field, different lengths of wire" by The What-If Observatory, https://whatifobservatory.com/what-if/carrington-event/, licensed under CC BY 4.0 (https://creativecommons.org/licenses/by/4.0/)
Data: USGS Fact Sheet 2024-3036 (field and example line); The Atlantic Monthly, December 1859 (wire lengths); handset length is our assumption
Apply the same 10 volts per kilometer to a 15 cm handset, our assumed length, and you get 0.0015 volts, against 1,000 on the line. Even that overstates it, because a handset has no two grounded points far apart. Seeing: hazy, because this is our own reasoning and no source tests a handset. How many transistors sit inside it is a separate sum, which we grade under Moore's law.
What a phone leans on is more exposed. USGS says the 1989 storm damaged satellites and disrupted radio communication. A working handset with no power behind its network would not do much, though that is our inference, and we read no figure for it.
What would a Carrington event cost today?
Nobody we read can say within a narrow range. USGS gives $0.6 trillion to $2.6 trillion for a Carrington-class storm, for the United States alone, citing the National Research Council in 2008 and Lloyd's of London in 2013. As of our 2026-11-09 reading, we have not read those two reports themselves.
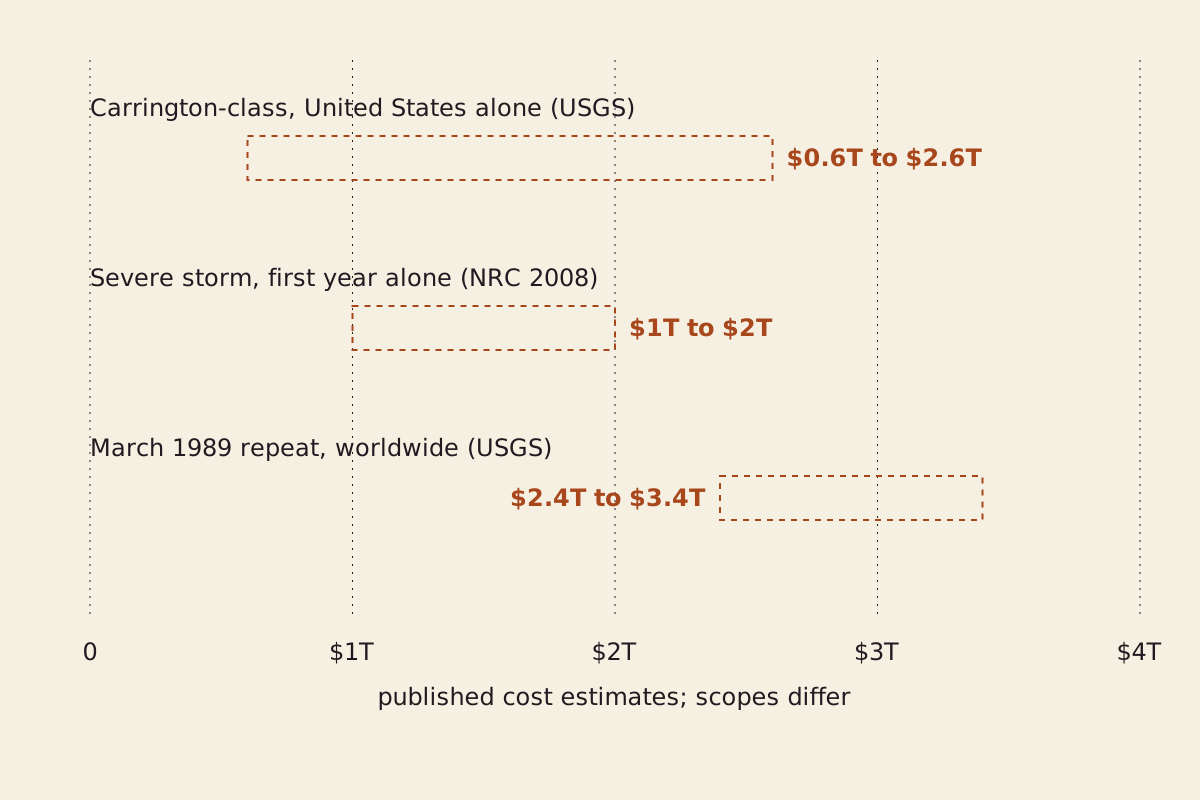
Three published ranges with different scopes, so they should not be ranked against each other. All three are drawn dashed because they sit past the dotted line.
"Three published cost ranges" by The What-If Observatory, https://whatifobservatory.com/what-if/carrington-event/, licensed under CC BY 4.0 (https://creativecommons.org/licenses/by/4.0/)
Data: USGS Fact Sheet 2024-3036, citing NRC 2008, Lloyd's 2013 and Schulte in den Bäumen et al. 2014; NRC 2008 as quoted by Cliver et al. 2022 (CC BY 4.0)
The 2022 review quotes the Research Council's figure for a severe space weather event as “$1 trillion to $2 trillion during the first year alone … with recovery times of 4–10 years” (sec. 1). USGS also cites $2.4 trillion to $3.4 trillion worldwide for a repeat of March 1989. That is a smaller storm with a larger number, and its scope is global, so the two do not line up.
The USGS range alone spans 4.3 times, so it does not meet our 3-times limit. A 2021 review by Edward Oughton blames “a lack of consensus regarding the potential impacts,” along with few major events. Love's team ties this directly to storm size, calling risk estimates for modern systems “very uncertain” too.
The dotted line falls after step 5. Up to there, every reading has a named source or a stated assumption, and the arithmetic reruns from the table below.
Step 6 asks what a repeat would break on today's grid, and we read no model that goes from nanoteslas to equipment lost. From here on, we are guessing. Step 7 puts dollars on that guess. Seeing: overcast.
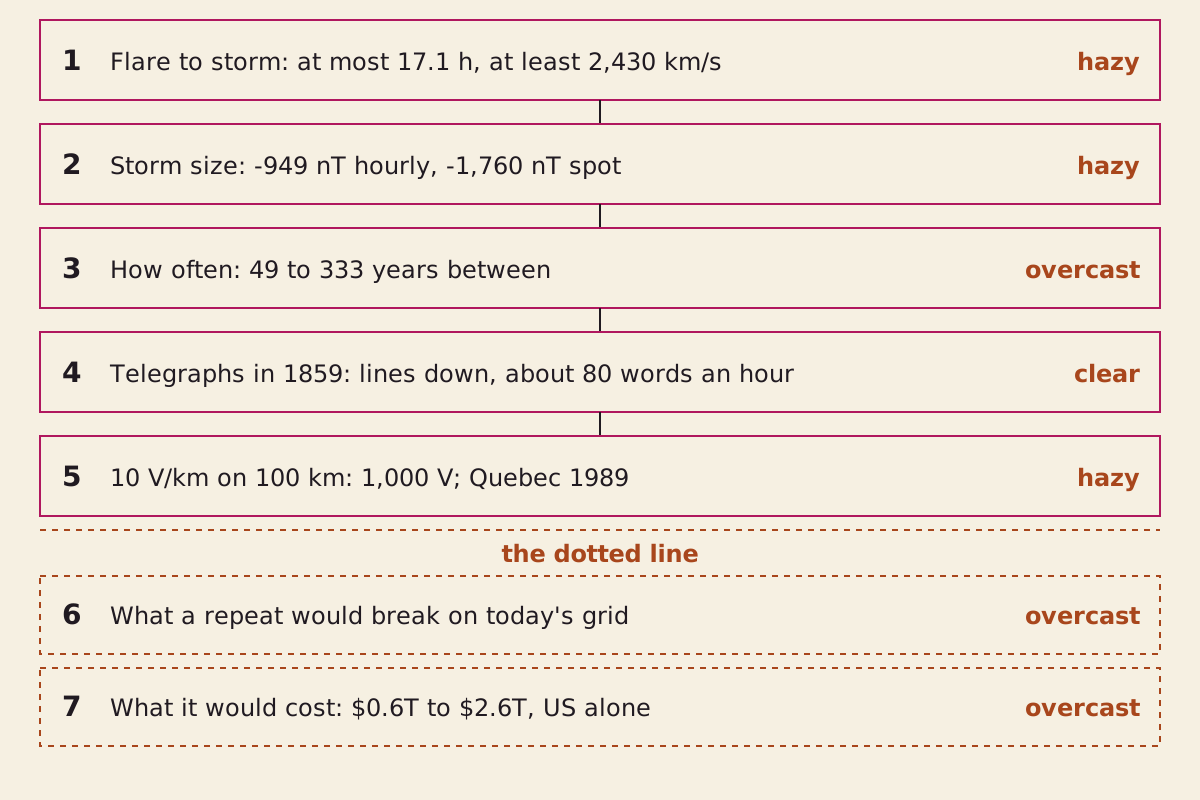
The chain behind this page. Steps 1 to 5 rest on named sources, with step 3 marked overcast because its fits disagree. Steps 6 and 7 sit past the dotted line.
"The chain behind this page: Carrington event" by The What-If Observatory, https://whatifobservatory.com/what-if/carrington-event/, licensed under CC BY 4.0 (https://creativecommons.org/licenses/by/4.0/)
So the flare, the readings, the telegraphs and the voltage sum sit above that line, and the damage and the bill sit below it.
Check my math:
| Step | Input | Value | Unit | Source no. | Source | Recomputed | Seeing |
|---|---|---|---|---|---|---|---|
| 1 | Flare to storm commencement | 17.03 | h | 2, 3 | secondary | yes | hazy |
| 1 | Same, from the paper's flare time | 17.08 | h | 3 | secondary | yes | hazy |
| 1 | Average speed, Sun to Earth, lower bound | 2,430 | km/s | 3, 7 | primary | yes | hazy |
| 1 | Time to cover the Earth-Moon distance at that speed | 158 | s | 3, 7 | site assumption | yes | hazy |
| 2 | Hourly estimate, 1859 | -949 | nT | 3, 2 | primary | no | hazy |
| 2 | Same, as a multiple of March 1989 | 1.61 | times | 3, 2 | secondary | yes | hazy |
| 2 | Low end of the hourly range, as a multiple of 1989 | 1.44 | times | 3, 2 | secondary | yes | hazy |
| 2 | High end of the hourly range, as a multiple of 1989 | 1.78 | times | 3, 2 | secondary | yes | hazy |
| 2 | Spot value, as a multiple of 1989 | 2.99 | times | 3, 2 | secondary | yes | hazy |
| 2 | Spot value against the low end of the hourly range | 2.07 | times | 3 | secondary | yes | hazy |
| 2 | Spot value against the high end of the hourly range | 1.68 | times | 3 | secondary | yes | hazy |
| 2 | Widest range the review prints | 2.82 | times | 2 | secondary | yes | hazy |
| 2 | Aurora road against magnetometer road | 1.26 | times | 2, 3 | primary | yes | hazy |
| 2 | Aurora formula, largest miss on six later storms | 1.83 | times | 2 | primary | yes | hazy |
| 3 | Waiting time for a -850 nT storm, shortest | 49 | years | 2 | secondary | no | overcast |
| 3 | Waiting time for a -850 nT storm, longest | 333 | years | 2 | secondary | no | overcast |
| 3 | Spread of those waiting times | 6.8 | times | 2 | secondary | yes | overcast |
| 3 | Median of the five rows at -850 nT | 97 | years | 2 | secondary | yes | overcast |
| 4 | Words per hour, Quebec to Father Point, approximate | 80 | words/h | 8 | primary | yes | clear |
| 4 | Seconds per word, Quebec to Father Point, approximate | 45 | s/word | 8 | primary | yes | clear |
| 4 | Time on aurora current alone, Boston to Portland | more than 2 | h | 8 | primary | no | hazy |
| 5 | Voltage on a 100 km line at 10 V/km | 1,000 | V | 1 | primary | yes | hazy |
| 5 | Same field along a 12-mile telegraph circuit | 193 | V | 1, 8 | site assumption | yes | hazy |
| 5 | Same field along a 60-mile telegraph circuit | 966 | V | 1, 8 | site assumption | yes | hazy |
| 5 | Same field along a 15 cm handset | 0.0015 | V | 1 | site assumption | yes | hazy |
| 5 | Pipeline current, bigger against smaller | 2.39 | times | 2 | secondary | yes | hazy |
| 6 | Damage to any named grid after a repeat | — | — | 1, 10 | secondary | no | overcast |
| 7 | Cost range, Carrington-class, United States alone | 0.6 to 2.6 | trillion USD | 1 | secondary | no | overcast |
| 7 | Spread of that range | 4.33 | times | 1 | secondary | yes | overcast |
| 7 | Cost, severe space weather event, first year alone | 1 to 2 | trillion USD | 2 | secondary | no | overcast |
| 7 | Cost, repeat of March 1989, worldwide | 2.4 to 3.4 | trillion USD | 1 | secondary | no | overcast |
Download carrington-check-my-math.csv (where its values come from)
Download carrington-estimates.csv (where its values come from)
The sums in the text were compared with the CSV, and voltage and speed units were checked. Where we restate a value through another paper, the row says whose it is.
Next question:
- What if Yellowstone repeated its largest eruption? The Yellowstone eruption
- What if chip counts had kept doubling every year? Moore's law, against the chips
Sources
- Jeffrey J. Love, Steven Sobieszczyk, E. Joshua Rigler, Anna Kelbert, Kristen A. Lewis (2024). “The Solar Cycle, Geology, and Geoelectric Hazards for Power Grids.” USGS Fact Sheet 2024-3036. Original Read: full text.
- Edward W. Cliver, Carolus J. Schrijver, Kazunari Shibata, Ilya G. Usoskin (2022). “Extreme solar events.” Living Reviews in Solar Physics 19:2. arXiv:2205.09265. Original Read: sections 1 and 6, parts of 5.2 and 8, with tables 5 to 7. Text license: CC BY 4.0.
- Hisashi Hayakawa, Heikki Nevanlinna, Séan P. Blake, Yusuke Ebihara, Ankush T. Bhaskar, Yoshizumi Miyoshi (2022). “Temporal Variations of the Three Geomagnetic Field Components at Colaba Observatory around the Carrington Storm in 1859.” Astrophysical Journal 928:32. arXiv:2109.13020. Original Read: preprint, the introduction, part of section 4 and the passages on chronology.
- Hisashi Hayakawa, Yusuke Ebihara, David M. Willis et al. (2019). “Temporal and Spatial Evolutions of a Large Sunspot Group and Great Auroral Storms around the Carrington Event in 1859.” Space Weather 17. arXiv:1908.10326. Original Read: preprint, auroral chronology and comparison sections.
- Jeffrey J. Love, E. Joshua Rigler, Hisashi Hayakawa, Kalevi Mursula (2024). “On the uncertain intensity estimate of the 1859 Carrington storm.” Journal of Space Weather and Space Climate 14. DOI 10.1051/swsc/2024015. Original Read: abstract in the USGS record; full paper not read; last read 2026-11-08.
- Bruce T. Tsurutani, Abhijit Sen, Rajkumar Hajra, Gurbax S. Lakhina, Richard B. Horne, Tohru Hada (2024). “Review of the August 1972 and March 1989 Space Weather Events: Can We Learn Anything New From Them?” Journal of Geophysical Research: Space Physics 129. arXiv:2409.00452. Original Read: abstract only. Text license: CC BY 4.0.
- T. W. Murphy Jr. (2013). “Lunar laser ranging: the millimeter challenge.” arXiv:1309.6294. Original Read: preprint, introduction, list of abbreviations and the sentence on tidal locking.
- “The Aurora Borealis.” The Atlantic Monthly, vol. 4, no. 26, December 1859. Unsigned. Original Read: full article.
- J. Rand Capron (1879). Auroræ: Their Characters and Spectra. Original Read: sections on the 1859 display and on telegraph wires.
- Lisa Wald and Jeffrey J. Love (2018). “Keeping the Lights On in North America.” USGS Geomagnetism Program. Original Read: full page.
- National Weather Service (April 2004). “Intense Space Weather Storms, October 19 – November 07, 2003.” Service Assessment. Original Read: sections: the impacts paragraph of the summary and the excerpt in Figure 12.
- Edward J. Oughton (2021). “The Economic Impact of Critical National Infrastructure Failure Due to Space Weather.” arXiv:2106.08945. Original Read: abstract only.
Cite this page
The What-If Observatory. "What If a Carrington Event Hit Today? The Size Is Disputed." Published 2026-11-09. https://whatifobservatory.com/what-if/carrington-event/. Add the date you read it.
Corrections
None so far.