Moore’s Law: Yearly Doubling in 1965? The Sources Disagree
The What-If Observatory Published
In 1965, Gordon Moore forecast chip components doubling about every year, by two later papers we could read. They report a 1975 revision to every two years, and his own papers we could only cite. Run both rates from 2,308 transistors in late 1971 to late 2021: the yearly pace overshoots Karl Rupp's top count of 58.2 billion about 45 million times, and the two-year pace lands within 1.34 times.
Steps in this reading (7)
- Suppose:
- it is 1965 and you read this.
- Hold fixed:
- Moore's own rates as later studies report them, and Karl Rupp's chip counts to 2021.
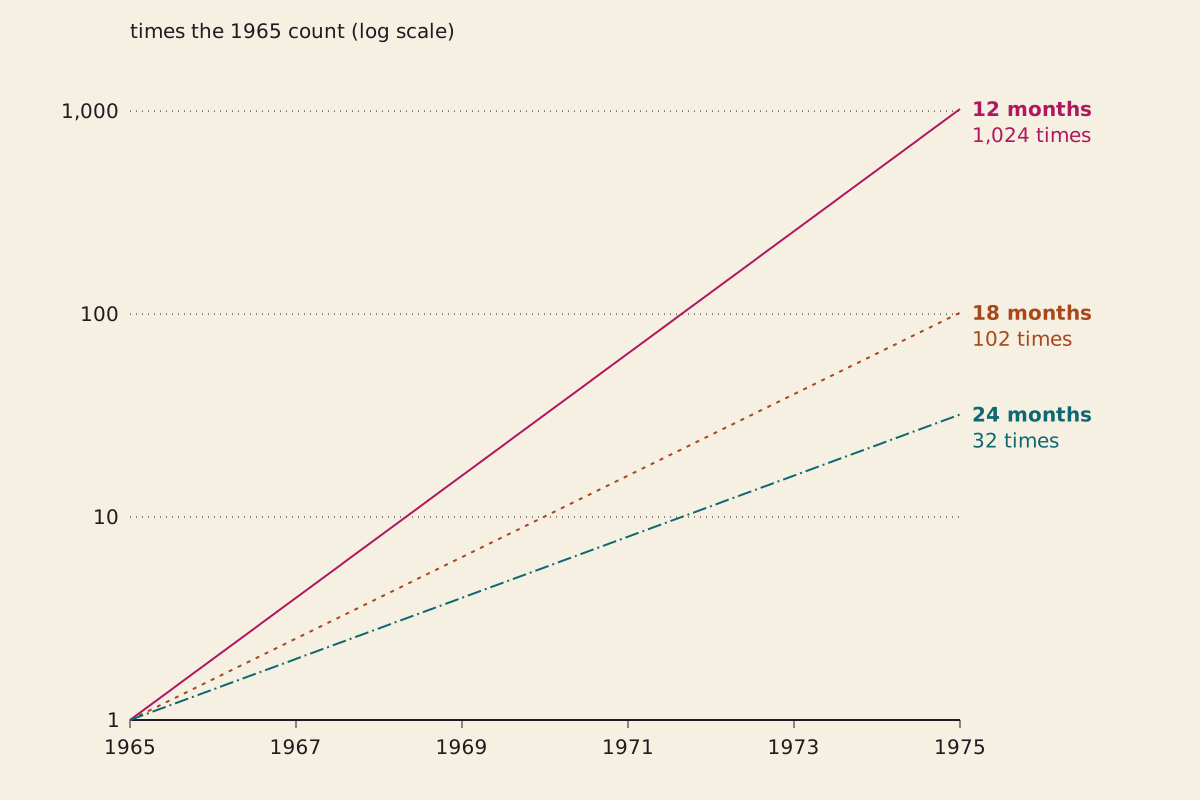
Ten years at each doubling period, on a log scale. The ten years are the gap between Moore's two estimates. The lines are arithmetic on reported rates, not chip counts.
"Ten years at three doubling periods" by The What-If Observatory, https://whatifobservatory.com/old-forecasts/moores-law/, licensed under CC BY 4.0 (https://creativecommons.org/licenses/by/4.0/)
Data: Burg & Ausubel 2021 (rates, CC BY); Zhang 2022 (dates, CC BY)
What did the 1965 forecast say?
One doubling about every year, according to the two papers we could read. We could not read Moore's 1965 article in Electronics or his 1975 conference paper, so both appear in the sources as citations only. This page quotes neither.
An integrated circuit, or chip, packs many electronic components onto one piece of silicon. The components that matter here are transistors, the tiny switches that chips are built from, so a forecast about components per chip is largely a forecast about how many switches fit on one part.
Each step below carries a Seeing mark, an astronomer's word for how much the air smears a view. On this page it rates how much weight a step can bear: clear, hazy or overcast (how we rate a reading). Whether the arithmetic itself is correct has a separate column at the end.
Step 1: the reported rates. In a 2021 PLOS ONE study, D. Burg and J. H. Ausubel write in their introduction that the trend “slowed from a doubling in the number of components per chip every year to doubling every two years.” A 2022 preprint by Nick Zhang says in its first section that Moore predicted a one-year doubling time in 1965, and “ten years later in 1975, he revised it to two years.” Seeing: hazy, because both accounts are secondhand.
The two papers differ on what doubles. Zhang writes of density, meaning transistors per unit area, while Burg and Ausubel write of components per chip, and we follow the peer-reviewed study in the rest of this page.
Not every account gives one year. A 2024 note from Our World in Data says that Moore, first describing the law in 1965, “observed that the number of transistors in an integrated circuit doubled every two years.” We cannot settle that disagreement against a paper we could not read, so we print both versions.
Step 2: what one year means. Ten years separate the two estimates. At the yearly pace that allows ten doublings, which multiply a count by 1,024, while five two-year doublings multiply it by 32. Seeing: hazy, because the sum is exact but both rates are secondhand, and Our World in Data's account of 1965 would erase this gap.
A one-year change in the period opens a 32-fold gap in a decade.
 Illustration
As later papers report it, the 1965 forecast was about how many components fit on one chip. Not to scale.
Illustration: The What-If Observatory. Generated schematic illustration — not a photograph or historical record. © The What-If Observatory, all rights reserved.
Verne's cannon, also in Old Forecasts, grades a machine. This file grades a rate.
How close did chips come?
Within 1.34 times over 50 years, at the two-year pace.
Step 3: two rows. Karl Rupp's openly licensed file lists transistor counts for microprocessors, the chips that run computers, without naming individual chips. Its first row, dated late 1971, holds 2,308 transistors, and its highest row, dated late 2021, holds 58.2 billion. That makes 24.59 doublings in 50.03 years, or one every 24.41 months. Seeing: hazy, because two rows ignore every chip between them.
Our World in Data reports the same two counts and an average doubling time of 2.03 years, which matches our sum. It describes those counts as averages, although in Rupp's file 58.2 billion is simply the largest of the rows dated around late 2021, so we call it the highest row.
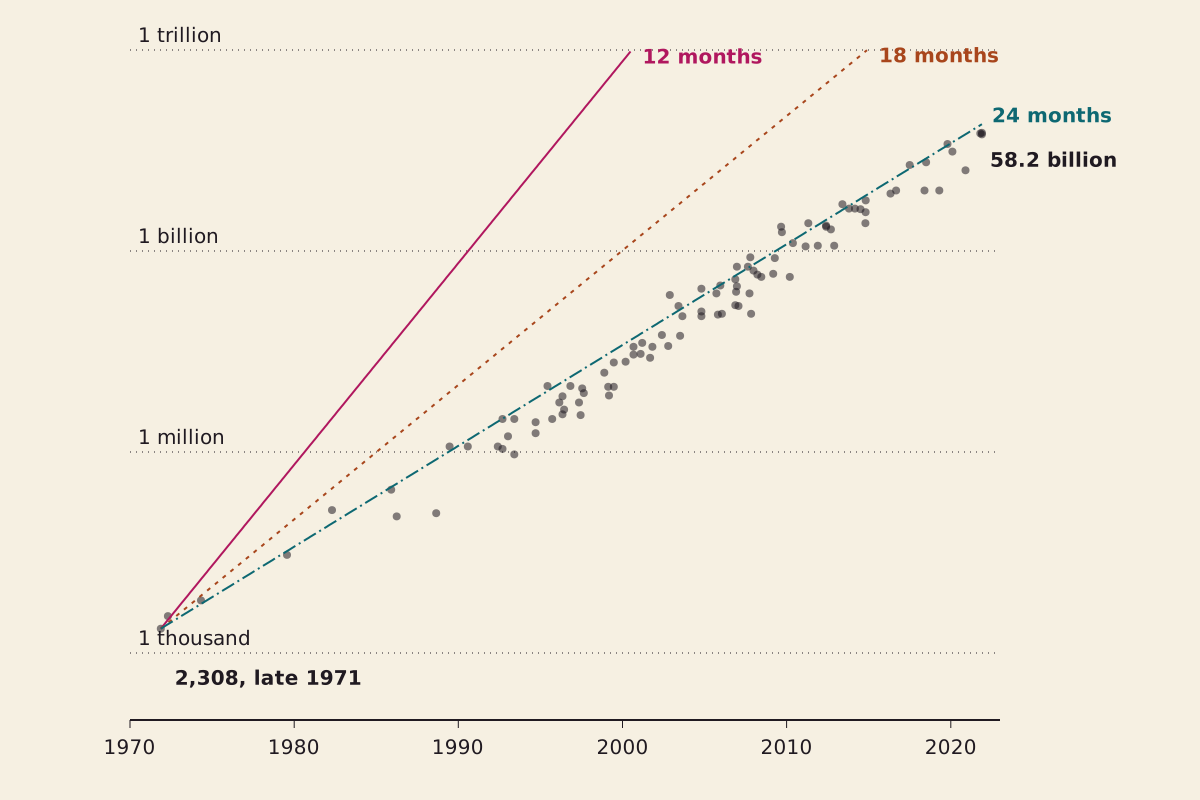
Each dot is one row of Karl Rupp's file, on a log scale. All three lines start from the first row. The 12-month and 18-month lines leave the chart at 1 trillion.
"Rupp's transistor counts against three doubling periods" by The What-If Observatory, https://whatifobservatory.com/old-forecasts/moores-law/, licensed under CC BY 4.0 (https://creativecommons.org/licenses/by/4.0/)
Data: Karl Rupp, Microprocessor Trend Data (counts)
Step 4: all the rows. A straight line through all 99 rows, on a log scale, gives one doubling every 23.94 months. This calculation comes from the same file, so it counts as a second method, not a second road. The file also starts six years after the forecast and contains only microprocessors, whereas the forecast, as reported, covered components per chip in general. Seeing: hazy.
What did 1975 change?
The period, from about one year to about two, as the later papers report it.
Burg and Ausubel fit two phases to Fairchild and Intel chips from 1959 to 2013, and they get doubling times of 14 and 25 months per chip. Those figures, they write in their results, “are similar to Moore's estimates from 1965 and 1975.”
Step 5: bigger chips. Transistor counts also rise because the chips themselves grow. In the same study, die area, the physical size of the chip, doubles every 8.3 years, and transistor count follows die area to the power of 4.4, so twice the area goes with about 21 times the transistors in their fit.
Measured as transistors per unit area, the doubling times stretch to 17 and 33 months, which the same section describes as “nearly 30% less rapid” than Moore's figures. As a rough check of ours, dividing the area growth out of 14 and 25 months gives 16.29 and 33.38 months. Seeing: hazy, because this check applies one area rate to every year, and the authors find the stepwise model unsuitable for their density data.
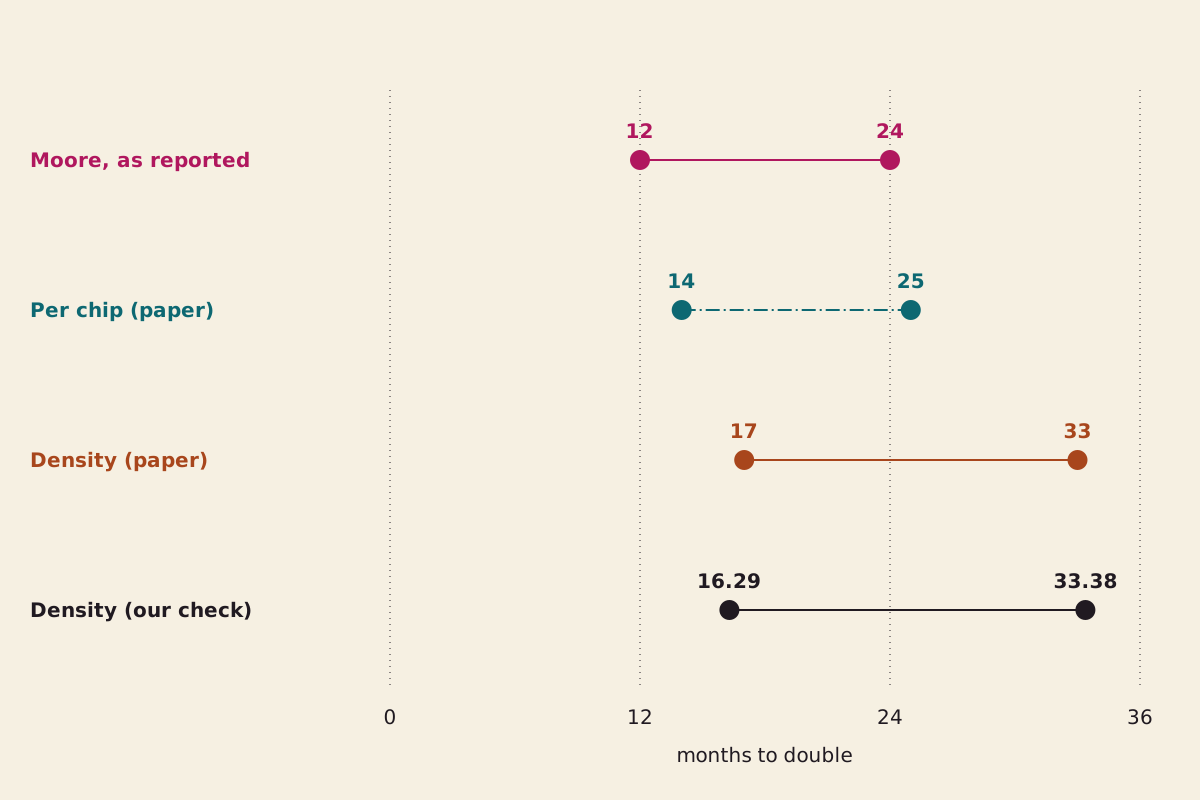
Two doubling times for each measure. The top three rows come from Burg and Ausubel's paper or its account of Moore. The bottom row is our rough check.
"Doubling times by measure" by The What-If Observatory, https://whatifobservatory.com/old-forecasts/moores-law/, licensed under CC BY 4.0 (https://creativecommons.org/licenses/by/4.0/)
Data: Burg & Ausubel 2021 (doubling times, die area, CC BY)
Where did 18 months come from?
We can say only where it sits: in the middle. The same sentence from Burg and Ausubel continues, “with an intermediate doubling time of 18 months.” We did not trace who said it first, so we do not grade it as Moore's.
Between two years and 18 months, two years fits Rupp's file far better, as the next step shows.
Step 6: where each rate lands. Start from 2,308 transistors in late 1971 and let each rate run for 50.03 years. Seeing: hazy, because the start and the finish are single rows.
| Doubling period | Count by late 2021 | Against the highest row, 58.2 billion | Reaches 58.2 billion in |
|---|---|---|---|
| 12 months | 2.6 quintillion | about 45 million times over | 1996 |
| 18 months | 25.3 trillion | 434 times over | 2008 |
| 24 months | 78.1 billion | 1.34 times over | 2021 |
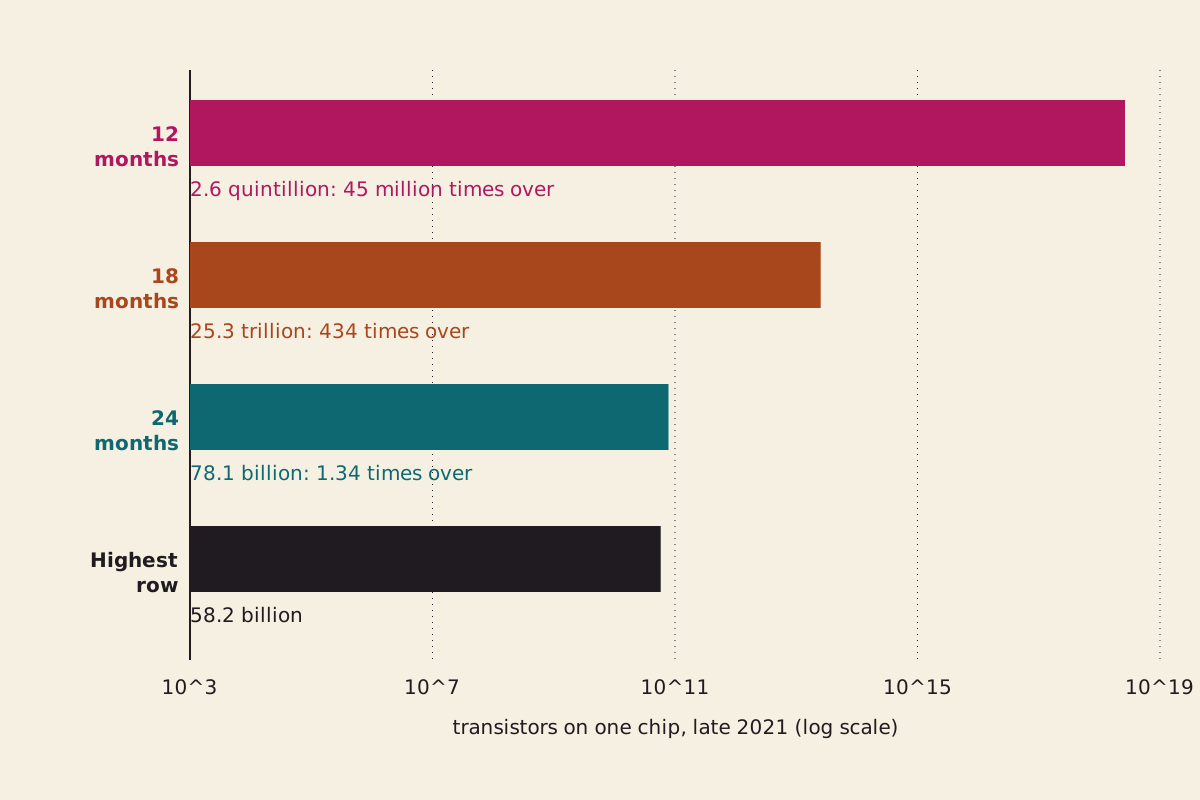
Where each rate lands after 50.03 years, on a log scale. The 12-month and 18-month bars are our extensions, carried past anything we read Moore claiming.
"Where each rate lands in late 2021" by The What-If Observatory, https://whatifobservatory.com/old-forecasts/moores-law/, licensed under CC BY 4.0 (https://creativecommons.org/licenses/by/4.0/)
Data: Karl Rupp, Microprocessor Trend Data (start and top counts)
At the yearly pace, chips would have reached 58.2 billion transistors during 1996, when the highest row dated up to then holds about 9.6 million. That comparison tests our extension, not Moore, because nothing we read says how long he meant the yearly pace to last.
Is Moore's law still true, and is it a law?
As of late 2021, the per-chip count in Rupp's file was still near the two-year pace, at 24.77 months for 2010 to 2021. The density measure had slowed in the papers we read. We read the name as a label for a trend, not as a law of nature.
Burg and Ausubel say in their introduction that these observations “are generally referred to as” Moore's law, and they call it “largely undisputed, though perhaps misunderstood” as a rule for the microprocessor industry. Zhang's first section says it is “not a mathematical theorem nor a law of physics” and calls it “a self-fulfilling prophecy.”
Step 7: windows. Separate lines through Rupp's rows give 28.48 months for 1971 to 1989, 28.39 for 1990 to 1999, 21.96 for 2000 to 2009 and 24.77 for 2010 to 2021. The years from 2015 to 2021 alone give 24.74, on 12 rows, slower than the 2000s but close to 24 months. Seeing: hazy, because we chose the windows and his file stops in 2021.
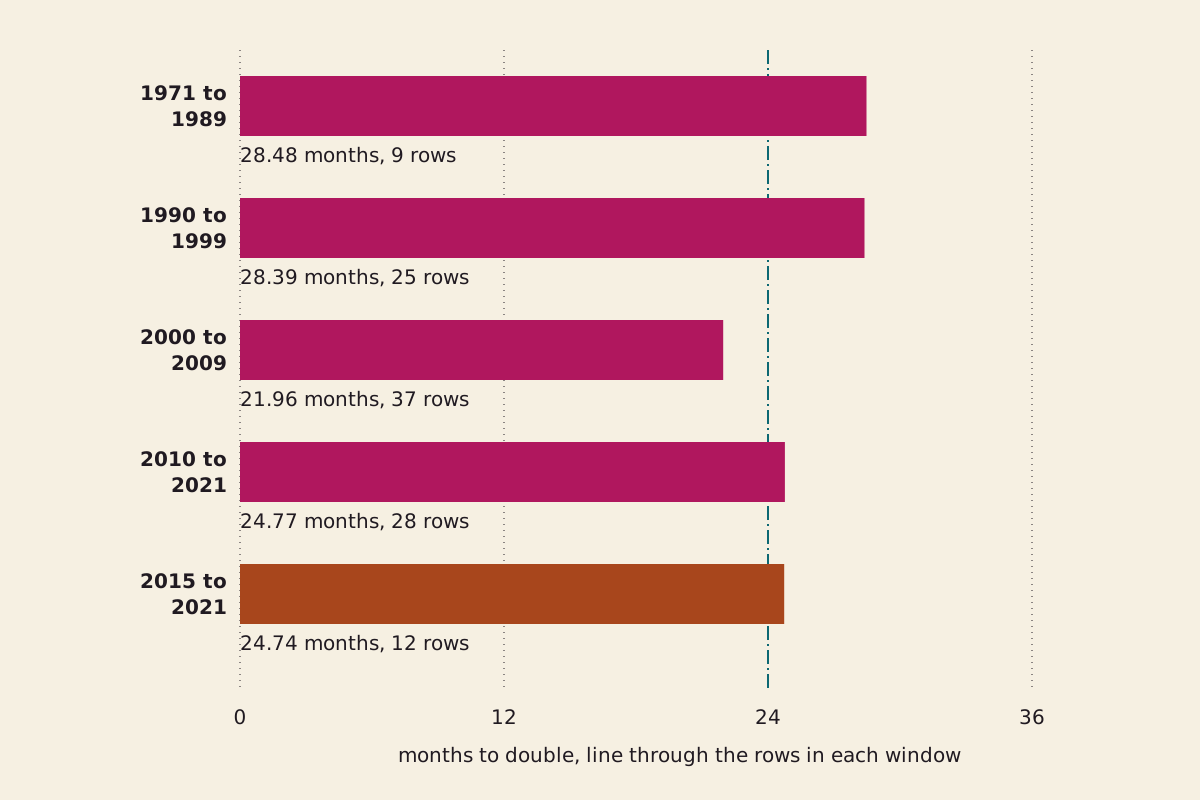
A separate line through the rows in each window, with 24 months marked. The windows are our choice, and the last one sits inside the one above it.
"Doubling period by window" by The What-If Observatory, https://whatifobservatory.com/old-forecasts/moores-law/, licensed under CC BY 4.0 (https://creativecommons.org/licenses/by/4.0/)
Data: Karl Rupp, Microprocessor Trend Data (counts)
Density reads differently. Burg and Ausubel write in their discussion that the past decade of their density data follows a linear trend, “a substantial departure from Moore's exponential law,” and they add that some researchers expected the silicon-based law to fail in approximately 2020.
Zhang writes that the doubling time is now more than three years, without giving an end date for that statement. Burg and Ausubel also note that Intel stopped reporting transistor counts and die sizes in 2014, so later figures for its chips are estimates.
So a chip count can keep its pace while density slows, because the chips themselves keep growing. Burg and Ausubel mention a wafer-scale chip with 1.2 trillion transistors, about 20.6 times the highest row in Rupp's file, and Zhang argues that some apparent speedups are an illusion, since certain chips package multiple dies. How much the law has slowed therefore depends partly on what counts as one chip.
How does the forecast grade?
Two hits and two untestable, across four items. We grade only what a source we read covers, and untestable here includes items the sources we read cannot settle. Each row is meant to stand alone.
| Item | Reported | Compared with | Grade |
|---|---|---|---|
| Doubling about every year, from 1965 | Yearly doubling, per chip in Burg and Ausubel and by density in Zhang | Burg and Ausubel's first phase of 14 months per chip, which their text leaves undated; the hit covers the per-chip wording only | hit |
| The yearly pace as a lasting rate | No end date in anything we read | Our extension to 2021 overshoots, but that tests us and not Moore | untestable |
| Doubling about every two years, from 1975 | A revision to two years, by two later papers | 24.41 and 23.94 months in Rupp's file, and 25 in Burg and Ausubel | hit |
| One steady exponential curve | Burg and Ausubel call exponential doubling per chip Moore's assumption, and say rates may change | Their density data fit logistic waves better, but Moore counted per chip, and their per-chip data show two exponential phases | untestable |
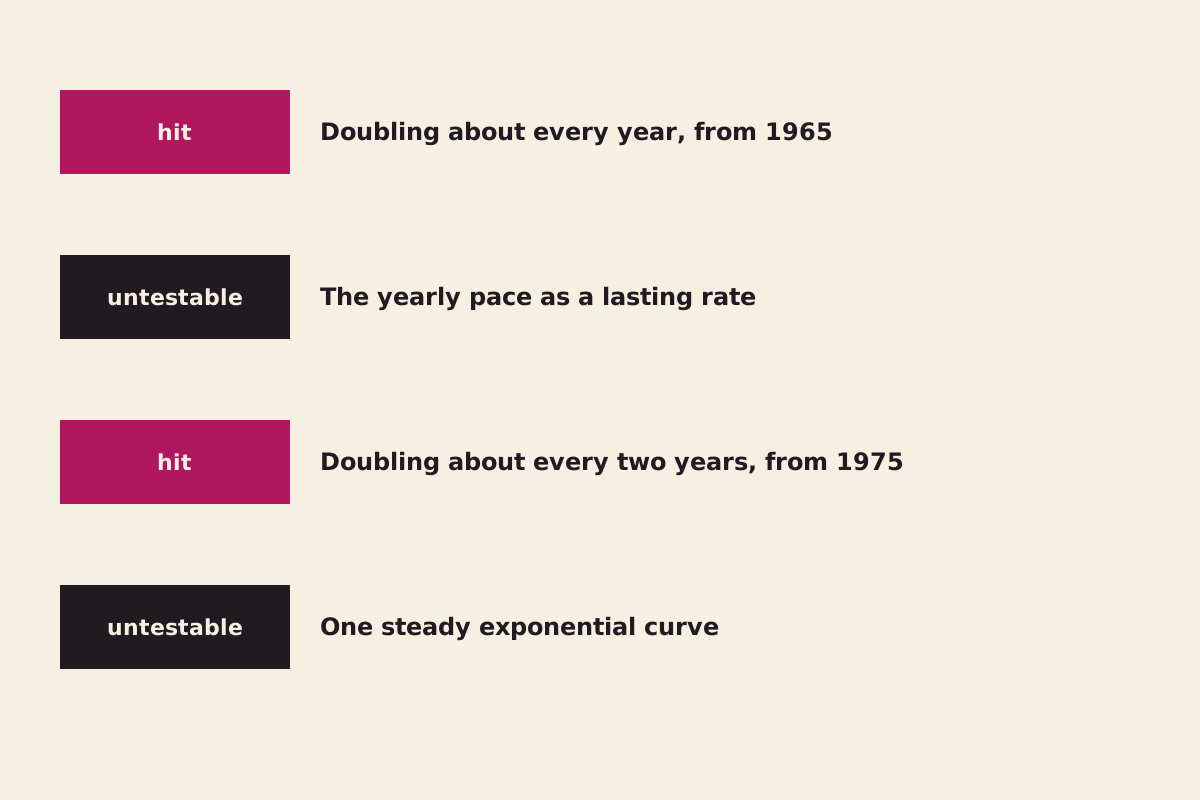
The four items and their grades. The table above says what each one was compared with.
"Four items on Moore's forecasts, graded" by The What-If Observatory, https://whatifobservatory.com/old-forecasts/moores-law/, licensed under CC BY 4.0 (https://creativecommons.org/licenses/by/4.0/)
Download moores-law-grades.csv (where its values come from) Data: Burg & Ausubel 2021 (CC BY); Zhang 2022 (CC BY); Karl Rupp, Microprocessor Trend Data
The last item stops short of a miss for two reasons. Nothing we read has Moore promising one smooth curve, and the wave test measures density, while on his own measure the same paper reproduces two exponential phases.
Burg and Ausubel still find six waves of density growth, each rising at least tenfold within approximately six years and then followed by at least three years of negligible growth. Exactly tenfold in six years works out to one doubling in about 21.67 months, and a steeper wave doubles sooner, so the long-run density average hides a stop-and-start pattern.
The authors also report that a stepwise exponential model underestimates 33 percent of their density data, and that a two-wave logistic model outperforms it statistically, even though that model is more complicated.
Step 8: the grades. No item earns the costume error, our grade for a right need dressed in hardware that never arrived, because nothing we read has this forecast naming a machine that failed. The title of the 1965 paper concerns integrated circuits, and those arrived. Seeing: hazy, since the grades are our judgment and the rates are secondhand.
Moore was not the only forecaster in the field. Their introduction mentions Moore's counterpart at Texas Instruments, whose 1964 prediction of logic-gate production a decade ahead “turned out to be a large underestimation.” They give no figures, so we leave it ungraded. Malthus also leans on repeated doubling, and his ratio gets its own file here.
Where does the reading stop?
The dotted line falls after step 8. Up to there, every reading rests on a paper we read, a data file anyone can rerun, or a sum shown on this page.
Step 9 asks when the next doubling comes, and how. Burg and Ausubel, in what their discussion calls “a speculative leap,” project that density may saturate “after one or possibly two more pulses.” We make no forecast of our own. From here on, we are guessing.
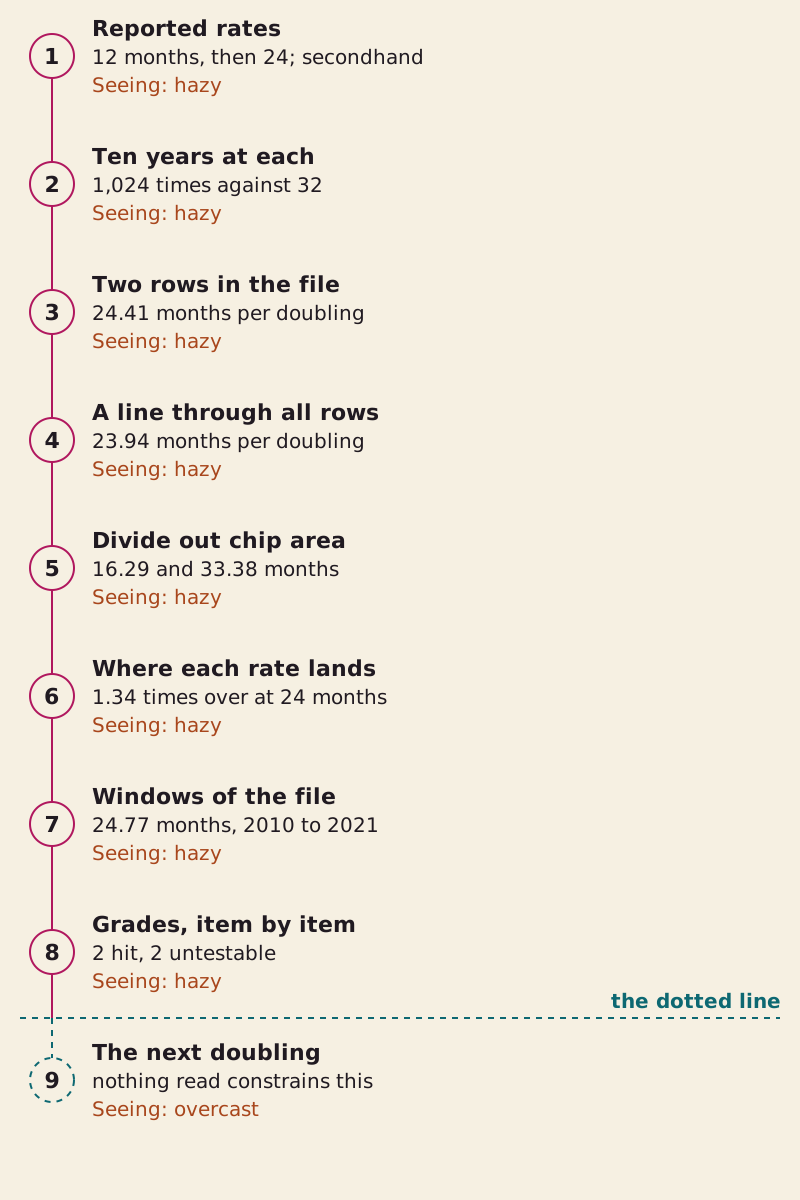
The chain behind this page. Steps 1 to 8 rest on two papers, one data file and sums shown here. Step 9 sits past the dotted line.
"The chain behind this page" by The What-If Observatory, https://whatifobservatory.com/old-forecasts/moores-law/, licensed under CC BY 4.0 (https://creativecommons.org/licenses/by/4.0/)
The reported rates and the chip counts sit above that line, and the next doubling sits below it. Seeing: overcast.
Check my math:
| Step | Input | Value | Unit | Source no. | Source | Recomputed | Seeing |
|---|---|---|---|---|---|---|---|
| 1 | Doubling period in the 1965 forecast | 12 | months | 1, 2 | secondary | no | hazy |
| 1 | Doubling period after the 1975 revision | 24 | months | 1, 2 | secondary | no | hazy |
| 2 | Growth over ten years at 12 months | 1,024 | times | 1, 2 | site assumption | yes | hazy |
| 2 | Growth over ten years at 24 months | 32 | times | 1, 2 | site assumption | yes | hazy |
| 3 | First row, late 1971 | 2,308 | transistors | 3, 4 | secondary | no | hazy |
| 3 | Highest row, late 2021 | 5.82 × 10^10 | transistors | 3, 4 | secondary | no | hazy |
| 3 | Years between the two rows | 50.03 | years | 3 | secondary | yes | hazy |
| 3 | Doublings between the two rows | 24.59 | doublings | 3 | secondary | yes | hazy |
| 3 | Doubling period from the two rows | 24.41 | months | 3, 4 | secondary | yes | hazy |
| 4 | Doubling period, line through all rows | 23.94 | months | 3 | secondary | yes | hazy |
| 5 | Transistors per chip, first phase | 14 | months | 1 | primary | no | hazy |
| 5 | Transistors per chip, second phase | 25 | months | 1 | primary | no | hazy |
| 5 | Density, first phase | 17 | months | 1 | primary | no | hazy |
| 5 | Density, second phase | 33 | months | 1 | primary | no | hazy |
| 5 | Die area doubling period | 99.6 | months | 1 | primary | yes | hazy |
| 5 | Count factor for twice the die area | 21.11 | times | 1 | primary | yes | hazy |
| 5 | First phase with area divided out | 16.29 | months | 1 | site assumption | yes | hazy |
| 5 | Second phase with area divided out | 33.38 | months | 1 | site assumption | yes | hazy |
| 6 | Top count at the 12-month rate | 2.64 × 10^18 | transistors | 1, 3 | site assumption | yes | hazy |
| 6 | Top count at the 18-month rate | 2.53 × 10^13 | transistors | 1, 3 | site assumption | yes | hazy |
| 6 | Top count at the 24-month rate | 7.81 × 10^10 | transistors | 1, 3 | site assumption | yes | hazy |
| 6 | Overshoot at the 12-month rate | 4.54 × 10^7 | times | 1, 3 | site assumption | yes | hazy |
| 6 | Overshoot at the 18-month rate | 434.22 | times | 1, 3 | site assumption | yes | hazy |
| 6 | Overshoot at the 24-month rate | 1.34 | times | 1, 3 | site assumption | yes | hazy |
| 6 | Year the 12-month rate reaches the top count | 1996.46 | year | 1, 3 | site assumption | yes | hazy |
| 6 | Highest row by that year | 9.65 × 10^6 | transistors | 3 | secondary | yes | hazy |
| 6 | Year the 18-month rate reaches the top count | 2008.76 | year | 1, 3 | site assumption | yes | hazy |
| 6 | Highest row by that year | 8.06 × 10^8 | transistors | 3 | secondary | yes | hazy |
| 7 | Doubling period, 1971 to 1989 | 28.48 | months | 3 | secondary | yes | hazy |
| 7 | Doubling period, 1990 to 1999 | 28.39 | months | 3 | secondary | yes | hazy |
| 7 | Doubling period, 2000 to 2009 | 21.96 | months | 3 | secondary | yes | hazy |
| 7 | Doubling period, 2010 to 2021 | 24.77 | months | 3 | secondary | yes | hazy |
| 7 | Doubling period, 2015 to 2021 | 24.74 | months | 3 | secondary | yes | hazy |
| 7 | Wafer-scale chip in the 2021 paper | 1.2 × 10^12 | transistors | 1 | secondary | no | hazy |
| 7 | That chip against the highest row | 20.62 | times | 1, 3 | site assumption | yes | hazy |
| 8 | Doubling period at tenfold in six years | 21.67 | months | 1 | site assumption | yes | hazy |
| 8 | Items graded | 4 | items | 1, 2, 3 | site assumption | no | hazy |
| 9 | The next doubling | — | — | 1 | site assumption | no | overcast |
Download moores-law-check-my-math.csv (where its values come from) Data: Burg & Ausubel 2021 (CC BY); Zhang 2022 (CC BY); Karl Rupp, Microprocessor Trend Data; Mathieu 2024, Our World in Data
Download moores-law-chips.csv (where its values come from) Data: Burg & Ausubel 2021 (CC BY); Karl Rupp, Microprocessor Trend Data; Mathieu 2024, Our World in Data
Months here are twelfths of a year. Units were checked, and the computed numbers in the text were compared with the CSV.
Next question:
- How many watts is Type I? The Kardashev scale, in watts
- What if Malthus's ratio had held? Malthus's doubling, graded
Sources
- Burg, D. & Ausubel, J. H. (2021). “Moore’s Law revisited through Intel chip density.” PLOS ONE 16(8): e0256245. Original Read: full text; quotations are from the Introduction, Results and Discussion. Text license: CC BY 4.0.
- Zhang, N. (2022). “Moore's Law is dead, long live Moore's Law!” arXiv:2205.15011, a preprint. Original Read: preprint, abstract, section 1 and references; quotations are from the abstract and section 1. Text license: CC BY 4.0.
- Rupp, K. Microprocessor Trend Data, 50-year set, file transistors.dat. GitHub repository karlrupp/microprocessor-trend-data. Original Read: full data file for transistors, with its plot label for units, the README and the license. Text license: CC BY 4.0.
- Mathieu, E. (2024, April 15). “Moore’s law has accurately predicted the progress in transistor counts over the last 50 years.” Our World in Data, Data Insights. Original Read: full page of the note.
- Moore, G. E. (1965). “Cramming more components onto integrated circuits.” Electronics 38, from p. 114; later citations end it at 117 or 118. Original Read: bibliography only; not read, cited via Burg & Ausubel 2021.
- Moore, G. E. (1975). “Progress in Digital Integrated Electronics.” IEDM Tech. Digest, pp. 11–13. Original Read: bibliography only; not read, cited via Zhang 2022.
Cite this page
The What-If Observatory. "Moore’s Law: Yearly Doubling in 1965? The Sources Disagree." Published 2026-11-09. https://whatifobservatory.com/old-forecasts/moores-law/. Add the date you read it.
Corrections
None so far.