Malthus: His 512 to 10, People to Food, Had No Date
The What-If Observatory Published
In 1798, Thomas Malthus wrote two columns: 1, 2, 4 up to 512, and 1, 2, 3 up to 10. After “two centuries and a quarter,” he said (ch. 2), population would stand to food as 512 to 10, if nothing held it back. His sum is right, but it is a supposition with no date. From 1800 to 2023, the world's count grew 8.23 times by Our World in Data's estimates, under the 9.92 times his food column gives if we hold food per person at its 1800 level.
Steps in this reading (7)
- Suppose:
- it is 1798 and you read this.
- Hold fixed:
- Malthus's own ratios, and his 25-year doubling as a supposition, not a date.
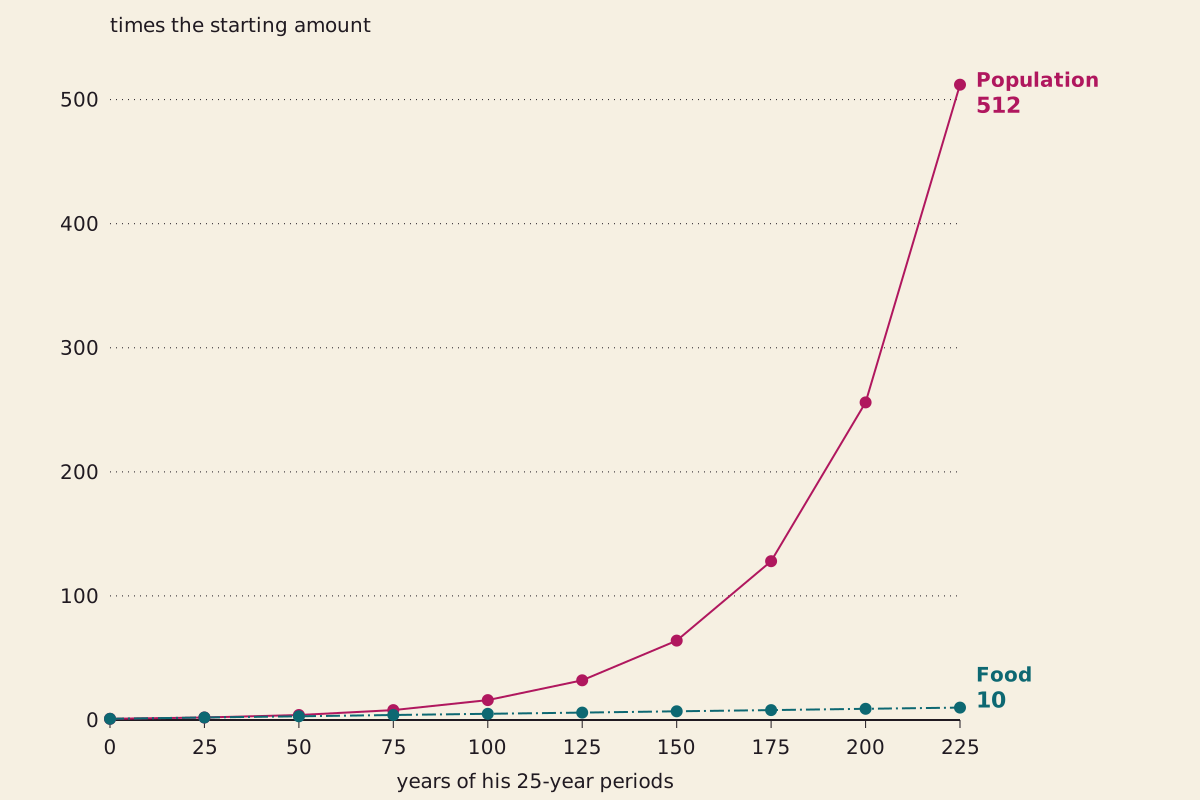
His two columns, period by period, on an ordinary scale. Each period is 25 years. The lines carry out his supposition and count nobody.
"Malthus's two columns over 225 years" by The What-If Observatory, https://whatifobservatory.com/old-forecasts/malthus/, licensed under CC BY 4.0 (https://creativecommons.org/licenses/by/4.0/)
Data: T. R. Malthus, An Essay on the Principle of Population (1798), public domain
What did Malthus actually write?
He wrote a conditional sum and said so. His rate came from the United States, where he reported that population “has been found to double itself in twenty-five years.” It became his rule for population “when unchecked” in chapter 2 of the essay, and he called it a geometrical ratio, which means growth by multiplication.
Food got an arithmetical ratio, which means growth by addition. He allowed the produce of “this Island” to double in the first 25 years and then to add the same amount in every later period, a rule he described as “certainly far beyond the truth” (ch. 2).
Each step below carries a Seeing mark. In astronomy, seeing rates how badly moving air blurs a star, and here it rates how much weight a step can bear: clear, hazy or overcast (how we rate a reading). Whether the sum itself is correct has its own column at the end.
Step 1: the columns. He took the world's population at “a thousand millions, for instance,” then ran population as 1, 2, 4 and on to 512, and subsistence, his word for the means of living, as 1, 2, 3 and on to 10. Nine doublings and nine added steps reproduce his 512 to 10 exactly, and twelve of each reproduce his “4096 to 13” for three centuries (ch. 2). Seeing: clear.
On his thousand millions, the first pair means 512 billion people with food for 10 billion. The two thousand years he called “almost incalculable” (ch. 2) work out to 80 doublings against 80 added food steps, a column of 81, or about 1.5 × 10^22 to 1.

Thomas Robert Malthus, as printed in Popular Science Monthly in April 1909, in a number marking the centenary of Darwin's birth.
"PSM V74 D416 Thomas Robert Malthus" by unknown creator — https://commons.wikimedia.org/wiki/File:PSM_V74_D416_Thomas_Robert_Malthus.png — Public domain in the US (published 1909) and in the EU (printed without a named maker by April 1909, more than 70 years since first publication); modified: cropped to head and collar, 16:9

That world was never on offer, because the sum asks you to “suppose that the restraints to population were universally removed” (ch. 2), and the following pages explain why he expected otherwise.
Step 2: the Island. He ran the same sum for Britain, starting from about seven million people and food for seven million. After 25, 50, 75 and 100 years he reaches 14, 28, 56 and 112 million people against food for 14, 21, 28 and 35 million, which, in chapter 2, leaves “seventy-seven millions totally unprovided for,” and the subtraction checks. Seeing: clear.
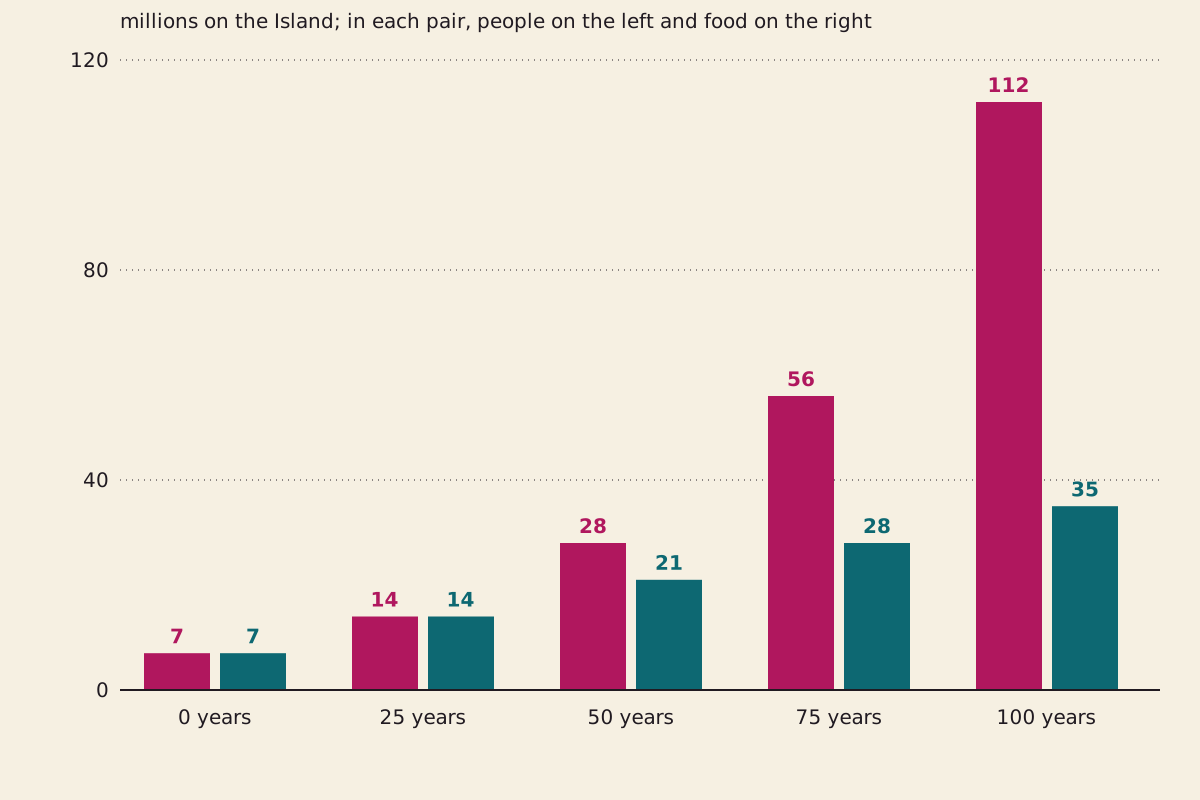
The Island over one century, in his own figures. These are unchecked sums, so no census could confirm or refute them.
"Malthus's Island over one century" by The What-If Observatory, https://whatifobservatory.com/old-forecasts/malthus/, licensed under CC BY 4.0 (https://creativecommons.org/licenses/by/4.0/)
Data: T. R. Malthus, An Essay on the Principle of Population (1798), public domain
The United Kingdom, on larger borders than his Island, held 41.1 million people in 1900 by Our World in Data's estimate, but those people were not unchecked, so that figure cannot grade his 112 million.
He set no date for any crisis, either. Arguing with Condorcet in chapter 8, he wrote that the time when numbers surpass their food “has long since arrived,” and that the resulting periodic misery “does exist at present, and will for ever continue to exist,” barring a change in human nature. A claim about forever has no year we could check.
Whose arithmetic was it?
Not his alone, by his own account. His first chapter says the most important argument “is certainly not new,” that it was explained in part by Hume and “more at large by Dr Adam Smith,” and that a Mr Wallace had applied it to the same subject.
The American rate also came through other writers. Chapter 6 takes its colonial figures from Dr Price's Observations and admits that Malthus did not have the pamphlet by Dr Styles that Price was quoting.
Step 3: New England. Those figures give 21,200 settlers in the four New England provinces in 1643 and half a million in 1760. That makes 4.56 doublings in 117 years, or one every 25.66 years, so his round 25 holds on his own numbers. Seeing: hazy, because the end figure is round and reached him through two other writers.
He does not hide the spread, reporting about 22 years for New Jersey, 15 for the back settlements and about 35 for the sea coast.
Step 4: after he wrote. Our World in Data, which compiles long-run estimates from other groups, has the United States at 6.00 million in 1800 and 44.6 million in 1875, which is 2.89 doublings in 75 years, or one every 25.91. The next 75 years stretch to one every 41.91. Seeing: hazy, because these totals include migrants and use today's borders.
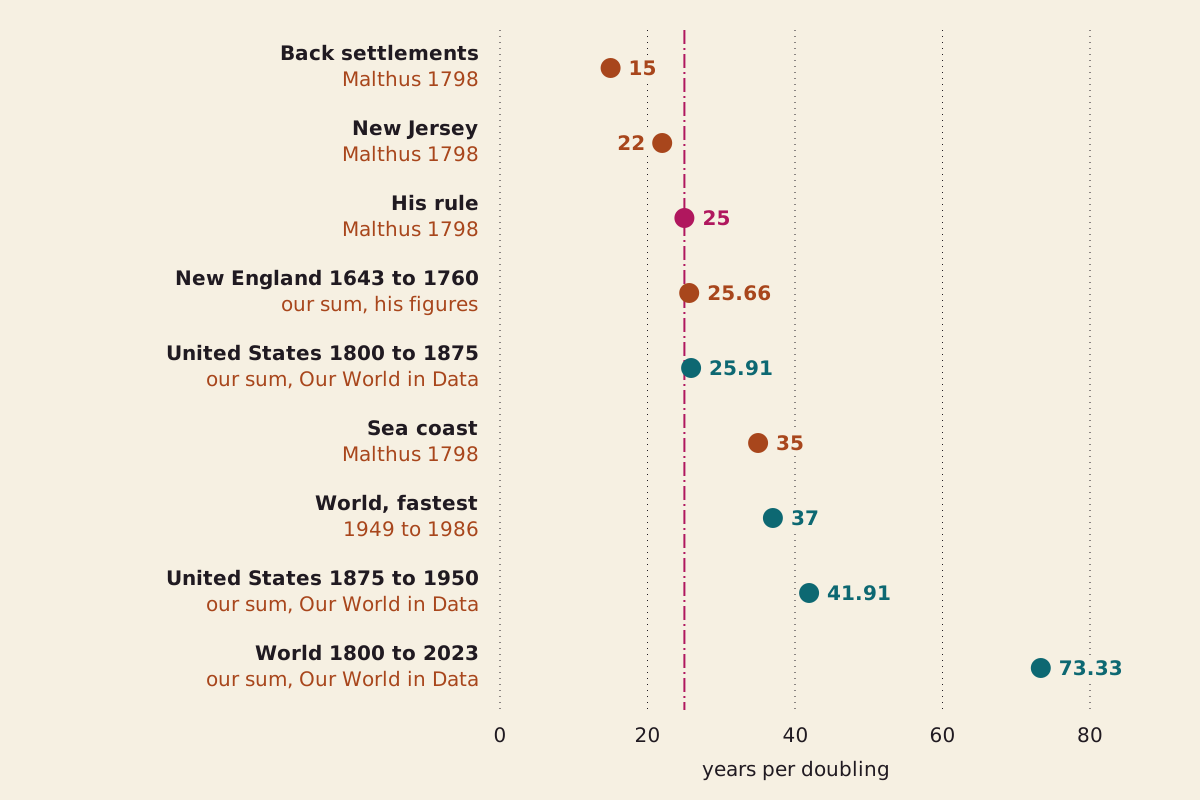
Years per doubling, fastest at the top. The rows marked Malthus 1798 are figures he printed. The dashed line is his rule of 25 years.
"Years per doubling, by place and period" by The What-If Observatory, https://whatifobservatory.com/old-forecasts/malthus/, licensed under CC BY 4.0 (https://creativecommons.org/licenses/by/4.0/)
Data: Our World in Data, Population, from Gapminder v7 and UN World Population Prospects 2024, upstream not traced back
So, as an average between those two counts, the rate he borrowed held in that country's total, migrants included, for another 75 years.
Did the world double every 25 years?
No, not once in this series from 1800 on.
Step 5: the world. Our World in Data gives 983 million people in 1800 and 8.09 billion in 2023. That is a multiple of 8.23, or 3.04 doublings in 223 years, which averages one doubling every 73.33 years. Seeing: hazy, because the early counts are estimates and we read them only through that series.
Its fastest doubling took 37 years, from 1949 to 1986, with start years through 1956 tying it, and its largest gain in any 25-year stretch was 1.63 times, from 1951 to 1976. The same series also feeds our count of everyone ever born.
He named no start year. Counted from the essay itself, 225 years would end in 2023, but that reading is our assumption, so we start from the 1800 row, the nearest one the series offers. Carried from there, his population column reaches about 484 times by 2023, which is 58.8 times the actual multiple.
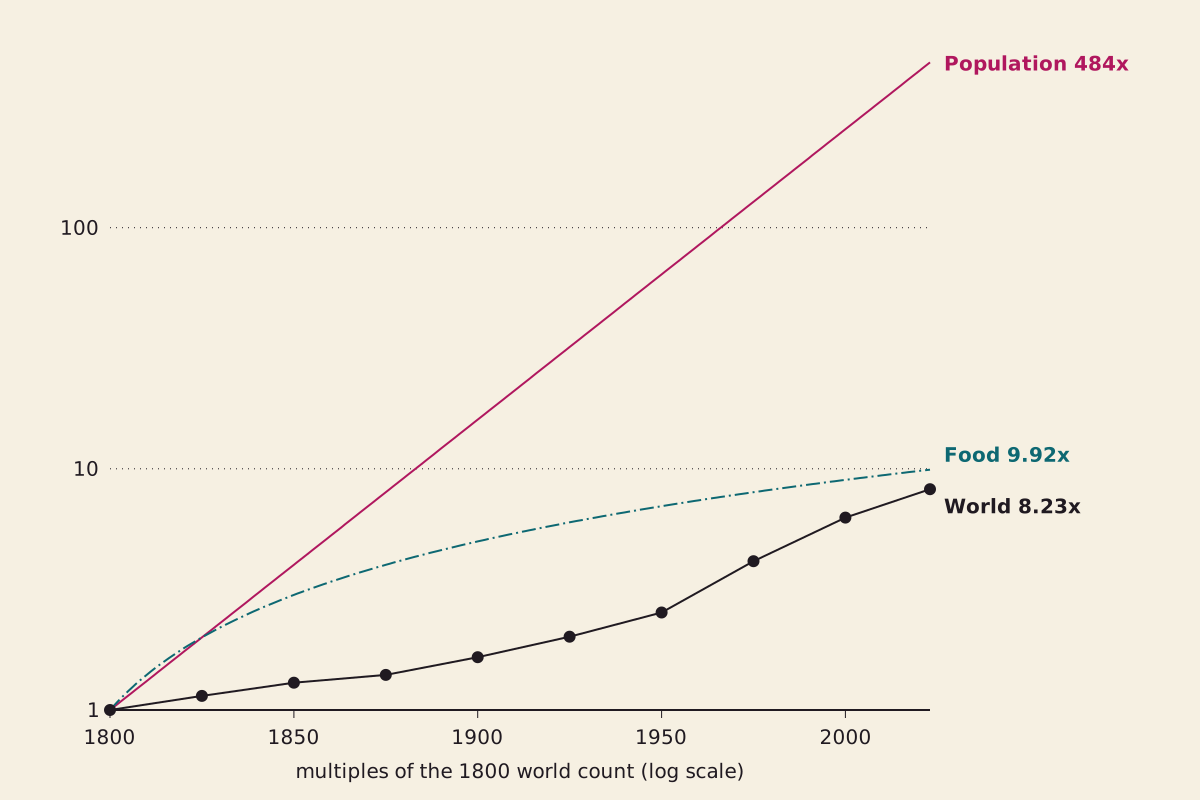
All three lines start from the 1800 world count. The start year is ours, and the food line counts heads at 1800 food per person. The world line joins the ten counts in the download below; the yearly estimates stay under the food line from 1801 through 2023.
"World count against his two columns, 1800 to 2023" by The What-If Observatory, https://whatifobservatory.com/old-forecasts/malthus/, licensed under CC BY 4.0 (https://creativecommons.org/licenses/by/4.0/)
Data: Our World in Data, Population, from Gapminder v7 and UN World Population Prospects 2024, upstream not traced back
That gap proves little on its own, since it sets an unchecked supposition against a world with its checks in force, and those checks were his whole argument.
What about food?
This page uses no food tonnage table, only what the writers we read say in words, plus one comparison that counts heads.
Step 6: the food column. Give the 983 million people of 1800 his own step, food for another 983 million every 25 years. By 2023 that allowance feeds 9.75 billion, about 1.21 times the 8.09 billion actually alive, and the yearly estimates stay under that line from 1801 through 2023. Malthus said such a step would make the productive power of the earth “absolutely unlimited” (ch. 2). Seeing: hazy, because holding food per person at its 1800 level is our assumption.
The picture behind his rule appears in chapter 6, where fertile land is “a great reservoir of water, supplied by a moderate stream.” Settlers draw down the reservoir quickly, and once all the good land is taken, the yearly gain depends on that stream alone. That is the claim the fixed step stands for.
The total was generous. The shape is harder to read, because his rule adds one constant step of food, and what we count here is people. The number added per period did not stay constant, yet heads alone cannot show how much food each period added.
| Period | People added | Average growth per year | Basis |
|---|---|---|---|
| 1800 to 1825 | 142 million | 0.54% | Our sum on Our World in Data's estimates |
| 1825 to 1850 | 150 million | 0.50% | Our sum on Our World in Data's estimates |
| 1850 to 1875 | 99 million | 0.30% | Our sum on Our World in Data's estimates |
| 1875 to 1900 | 252 million | 0.68% | Our sum on Our World in Data's estimates |
| 1900 to 1925 | 352 million | 0.79% | Our sum on Our World in Data's estimates |
| 1925 to 1950 | 514 million | 0.93% | Our sum on Our World in Data's estimates |
| 1950 to 1975 | 1.58 billion | 1.98% | Our sum on Our World in Data's estimates |
| 1975 to 2000 | 2.10 billion | 1.68% | Our sum on Our World in Data's estimates |
| 2000 to 2023 | 1.92 billion | 1.18% | Our sum on Our World in Data's estimates |
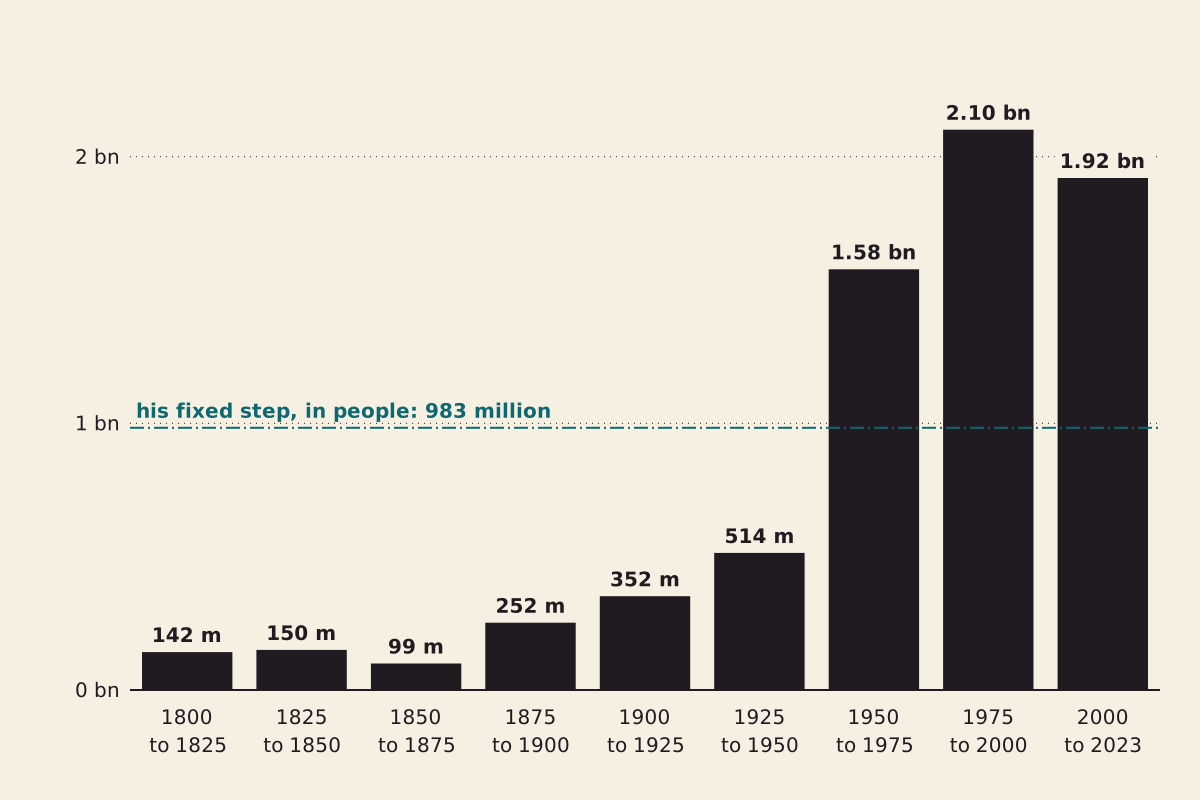
People added to the world count in each period. The last bar covers 23 years. The dashed line is one of his fixed steps on the 1800 count, in people and not in food.
"People added per period against his fixed step" by The What-If Observatory, https://whatifobservatory.com/old-forecasts/malthus/, licensed under CC BY 4.0 (https://creativecommons.org/licenses/by/4.0/)
Data: Our World in Data, Population, from Gapminder v7 and UN World Population Prospects 2024, upstream not traced back
Hannah Ritchie of Our World in Data writes that the world can now support more than 8 billion people, “with many consuming far in excess of requirements,” and that Malthus “should be surprised to see the current state of the world.” Her note adds that hundreds of millions were undernourished in 2016, largely for sociopolitical, stability and economic reasons rather than an inability to produce enough food.
She describes “a significant inflection in crop yield trends” during the 20th century, which she credits to fertilizer together with improved crop varieties, irrigation and mechanization.
Among those innovations, she gives synthetic nitrogen fertilizer the largest role. It became available from 1910 onward and “supports approximately half of the global population,” an estimate she describes as difficult to pin down, and the 48 percent for 2008 comes from Erisman and colleagues, whose paper we read only through her article.
Malthus had ruled out a second doubling of British produce as “contrary to all our knowledge of the qualities of land” (ch. 2), and in 1798 that knowledge did not include making fertilizer from atmospheric nitrogen.
Why did the ratio never arrive?
The world's numbers fell short on the population side, and the account we read there is the demographic transition.
Step 7: the transition. Max Roser of Our World in Data describes a sequence in which death rates fall first and birth rates follow later, and the gap between them produces a temporary surge in population.
World growth peaked at 2.3 percent a year in 1963, below the 2.81 percent his rule implies, and the same article gives today's rate as 0.9 percent, beside yearly figures it dates to 2025. Seeing: hazy, because the model describes a pattern without ranking its causes, and we do not rank them either.
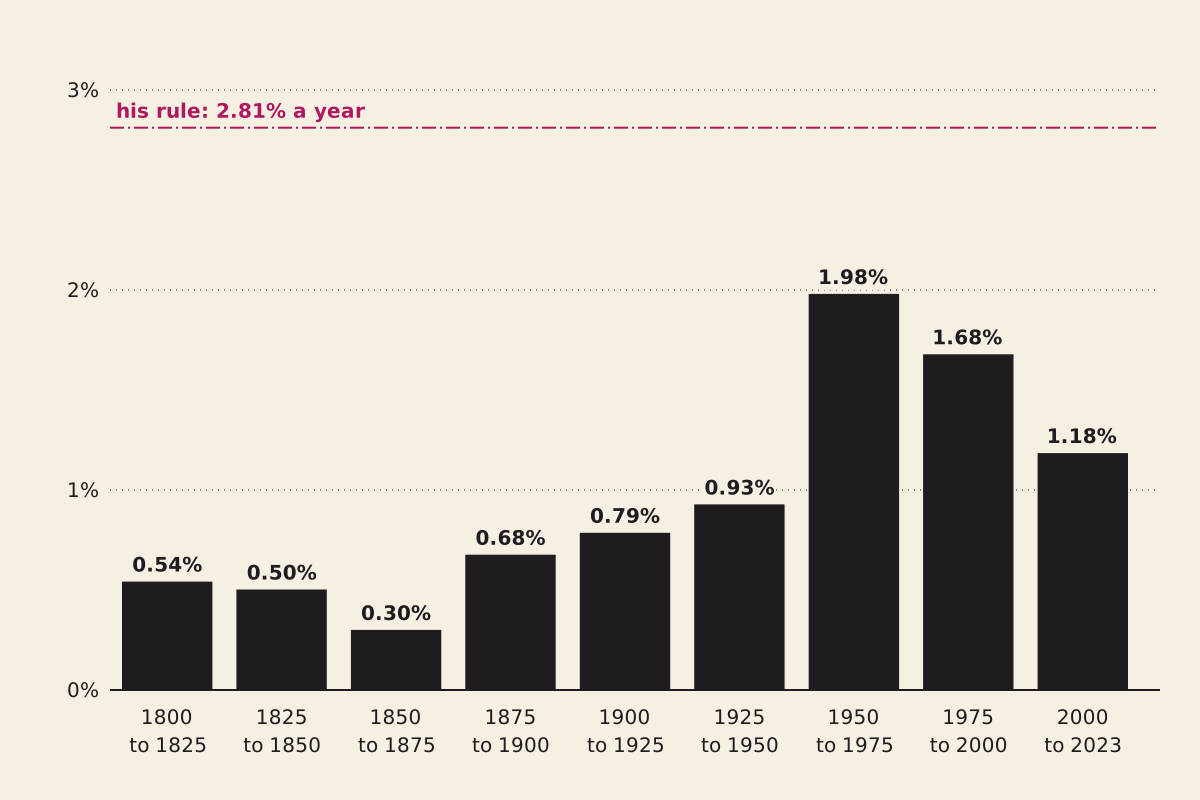
Average yearly growth in each period, against his rule. The averages hide the single-year peak of 2.3 percent in 1963, which Our World in Data reports.
"Average yearly growth of the world count, by period" by The What-If Observatory, https://whatifobservatory.com/old-forecasts/malthus/, licensed under CC BY 4.0 (https://creativecommons.org/licenses/by/4.0/)
Data: Our World in Data, Population, from Gapminder v7 and UN World Population Prospects 2024, upstream not traced back
Roser's summary of why fertility fell has three parts: parents adapt when fewer children die, children become less valuable economically, and women gain more power within society and partnerships. With Hannah Ritchie and Veronika Samborska, he writes that low fertility, not very high mortality, will keep population changes small in the new balance.
Malthus did see people holding back, since in chapter 2 “reason interrupts his career” and many postpone marriage. He added that this restraint “almost necessarily, though not absolutely so, produces vice,” so a fall in births by choice could still land in his own category. He wrote in chapter 5 that “all these checks may be fairly resolved into misery and vice,” and in chapter 1 that the human race cannot “by any efforts of reason” escape the law of necessity.
He met another way out in Condorcet, whom we know here only through his account. He read Condorcet as alluding to a practice “which would prevent breeding, or to something else as unnatural” (ch. 8), and he dismissed it. Malthus wrote all this against schemes for a perfected society, and Brook Farm is one such scheme with its own books.
What is the Malthusian trap?
It is a later label. The phrase does not appear in the 1798 text. Andrey Korotayev and Julia Zinkina use it in a 2015 paper for a situation “rather typical” of pre-industrial societies, where output growth does not lead “to the increase in per capita output” (p. 1) over the long range, because population grows faster.
The idea has at least one critic we read: Ron Nielsen, in a 2013 single-author preprint, calls the related idea of an epoch of Malthusian stagnation “scientifically unacceptable,” and his abstract questions demographic transition theory too. The two columns on this page test neither view, because the trap concerns income per person and we use no income series.
How does the forecast grade?
Two hits and four untestable, across six items. One of the hits grades his arithmetic only, not a forecast. We grade only what a source we read covers, and untestable here includes items the sources we read cannot settle.
| Item | What he wrote | Compared with | Grade |
|---|---|---|---|
| The sums themselves | 512 to 10 in 225 years, 4096 to 13 in 300, 77 million short on the Island | Recomputed: every printed figure comes out exact; this grades arithmetic, not a forecast | hit |
| American doubling in about 25 years | Population “found to double itself in twenty-five years” | New England 25.66 years on his figures; United States 25.91 years, 1800 to 1875, migrants included | hit |
| The unchecked world | Doubling every 25 years if restraints were removed | Restraints never were; the fastest world doubling took 37 years with them in force | untestable |
| The unchecked Island | 112 million people against food for 35 million after a century | United Kingdom, on larger borders, 41.1 million in 1900; not an unchecked count | untestable |
| Food adds one fixed step | “Subsistence increases only in an arithmetical ratio” | No food tonnage read; people added per period rose from 142 million to 2.10 billion, but heads are not food; yields jumped in the 20th century, with no figure to set against his step | untestable |
| Misery and vice as the only checks | “All these checks may be fairly resolved into misery and vice” | Fertility fell after mortality, as parents chose fewer children; he ties restraint itself to vice, a moral word no source we read measures | untestable |

The six items and their grades. The table above says what each one was compared with.
"Six items from Malthus, graded" by The What-If Observatory, https://whatifobservatory.com/old-forecasts/malthus/, licensed under CC BY 4.0 (https://creativecommons.org/licenses/by/4.0/)
Download malthus-grades.csv (where its values come from) Data: Our World in Data, Population, from Gapminder v7 and UN World Population Prospects 2024, upstream not traced back
The sums held, and the supposition never got its test.
Step 8: the grades. The food item would need a food series, and this page counts heads as a stand-in and assumes food per person did not fall, so it stays untestable here, whatever Ritchie's words suggest. “Vice” is his moral word, and no source we read measures it, so that item stays untestable too.
No item earns the costume error, our grade for a right need dressed in hardware that never arrived, because he named no machine at all, while Verne's cannon did. Seeing: hazy.
Moore's law, in the same category, is also a run of doublings, but that file grades a rate that could be checked against chip counts.
Where does the reading stop?
The dotted line falls after step 8. Up to there, every reading rests on his text, a data series anyone can rerun, an article we name, or a sum shown on this page.
Step 9 asks what a world on his two columns would have been like, with 512 billion people and food for 10 billion. Nothing we read constrains that, and we make no forecast of our own. From here on, we are guessing.
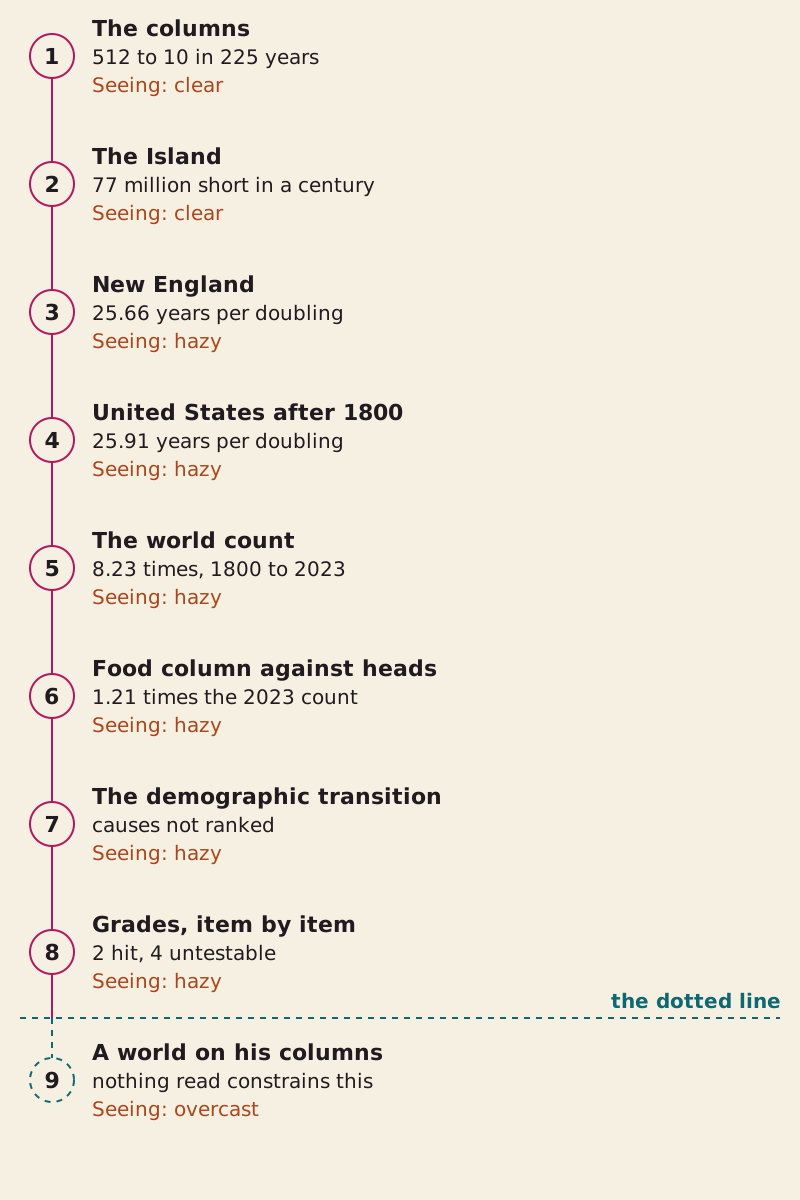
The chain behind this page. Steps 1 and 2 rest on his text and exact sums. Steps 3 to 8 add counts, articles and our own assumptions. Step 9 sits past the dotted line.
"The chain behind this page, step by step" by The What-If Observatory, https://whatifobservatory.com/old-forecasts/malthus/, licensed under CC BY 4.0 (https://creativecommons.org/licenses/by/4.0/)
His columns and the world's counts sit above that line, and a world that ran on his suppositions sits below it. Seeing: overcast.
Check my math:
| Step | Input | Value | Unit | Source no. | Source | Recomputed | Seeing |
|---|---|---|---|---|---|---|---|
| 1 | Doublings in two centuries and a quarter | 9 | doublings | 1 | primary | yes | clear |
| 1 | Population column after 225 years | 512 | times | 1 | primary | yes | clear |
| 1 | Food column after 225 years | 10 | times | 1 | primary | yes | clear |
| 1 | Population column after 300 years | 4,096 | times | 1 | primary | yes | clear |
| 1 | Food column after 300 years | 13 | times | 1 | primary | yes | clear |
| 1 | People on his thousand millions after 225 years | 512 | billion people | 1 | primary | yes | clear |
| 1 | Food on his thousand millions after 225 years | 10 | billion people fed | 1 | primary | yes | clear |
| 1 | Ratio after two thousand years | 1.49 × 10^22 | to 1 | 1 | primary | yes | clear |
| 2 | Island population, first century end | 112 | million people | 1 | primary | yes | clear |
| 2 | Island food, first century end | 35 | million people fed | 1 | primary | yes | clear |
| 2 | Island shortfall, first century end | 77 | million people | 1 | primary | yes | clear |
| 3 | New England settlers, 1643 | 21,200 | people | 1 | secondary | no | hazy |
| 3 | New England, 1760 | 500,000 | people | 1 | secondary | no | hazy |
| 3 | New England years per doubling | 25.66 | years | 1 | secondary | yes | hazy |
| 4 | United States, 1800 | 6 × 10^6 | people | 2, 3 | secondary | no | hazy |
| 4 | United States, 1875 | 4.46 × 10^7 | people | 2, 3 | secondary | no | hazy |
| 4 | United States, 1950 | 1.54 × 10^8 | people | 2, 3 | secondary | no | hazy |
| 4 | United Kingdom, 1900 | 4.11 × 10^7 | people | 2, 3 | secondary | no | hazy |
| 4 | United States years per doubling, 1800 to 1875 | 25.91 | years | 2, 3 | secondary | yes | hazy |
| 4 | United States years per doubling, 1875 to 1950 | 41.91 | years | 2, 3 | secondary | yes | hazy |
| 5 | World, 1800 | 9.83 × 10^8 | people | 2, 3 | secondary | no | hazy |
| 5 | World, 2023 | 8.09 × 10^9 | people | 2, 3 | secondary | no | hazy |
| 5 | World multiple, 1800 to 2023 | 8.23 | times | 2, 3 | secondary | yes | hazy |
| 5 | World years per doubling, 1800 to 2023 | 73.33 | years | 2, 3 | secondary | yes | hazy |
| 5 | Fastest world doubling in the series | 37 | years | 2, 3 | secondary | yes | hazy |
| 5 | Largest 25-year gain in the series | 1.63 | times | 2, 3 | secondary | yes | hazy |
| 5 | His column carried from 1800 to 2023 | 484.38 | times | 1 | site assumption | yes | hazy |
| 5 | His column against the world multiple | 58.85 | times | 1, 2 | site assumption | yes | hazy |
| 6 | His food column carried from 1800 to 2023 | 9.92 | times | 1 | site assumption | yes | hazy |
| 6 | His food step on the 1800 count, 2023 | 9.75 × 10^9 | people fed | 1, 2 | site assumption | yes | hazy |
| 6 | That line against the 2023 count | 1.21 | times | 1, 2 | site assumption | yes | hazy |
| 6 | People added, 1800 to 1825 | 1.42 × 10^8 | people | 2, 3 | secondary | yes | hazy |
| 6 | People added, 1825 to 1850 | 1.5 × 10^8 | people | 2, 3 | secondary | yes | hazy |
| 6 | People added, 1850 to 1875 | 9.93 × 10^7 | people | 2, 3 | secondary | yes | hazy |
| 6 | People added, 1875 to 1900 | 2.52 × 10^8 | people | 2, 3 | secondary | yes | hazy |
| 6 | People added, 1900 to 1925 | 3.52 × 10^8 | people | 2, 3 | secondary | yes | hazy |
| 6 | People added, 1925 to 1950 | 5.14 × 10^8 | people | 2, 3 | secondary | yes | hazy |
| 6 | People added, 1950 to 1975 | 1.58 × 10^9 | people | 2, 3 | secondary | yes | hazy |
| 6 | People added, 1975 to 2000 | 2.1 × 10^9 | people | 2, 3 | secondary | yes | hazy |
| 6 | People added, 2000 to 2023 | 1.92 × 10^9 | people | 2, 3 | secondary | yes | hazy |
| 6 | Share of people fed by nitrogen fertilizer, 2008 | 48 | percent | 6 | secondary | no | hazy |
| 7 | Yearly growth implied by doubling in 25 years | 2.81 | percent a year | 1 | site assumption | yes | hazy |
| 7 | Peak world growth, 1963 | 2.30 | percent a year | 4 | secondary | no | hazy |
| 7 | World growth, the current rate in that article | 0.90 | percent a year | 4 | secondary | no | hazy |
| 8 | Items graded | 6 | items | 1, 2, 4, 5, 6 | site assumption | no | hazy |
| 9 | A world on his two columns | — | — | 1 | site assumption | no | overcast |
Download malthus-check-my-math.csv (where its values come from) Data: Our World in Data, Population, from Gapminder v7 and UN World Population Prospects 2024, upstream not traced back; Roser, Ritchie and Samborska 2023, and Hannah Ritchie 2017, Our World in Data, CC BY
Download malthus-columns-and-world.csv (where its values come from) Data: Our World in Data, Population, from Gapminder v7 and UN World Population Prospects 2024, upstream not traced back
Years per doubling here are years divided by the base-2 logarithm of the growth. Units were checked, and the computed numbers in the text were compared with the CSV.
Next question:
- How many people have ever lived? Everyone ever born, counted two ways
- What if a commune kept real books? Brook Farm's accounts
Sources
- Malthus, T. R. (1798). An Essay on the Principle of Population. London: J. Johnson. Original Read: full text of the 1798 first edition.
- Our World in Data. “Population” (long-run data). Upstream: HYDE 3.3 (10,000 BCE to 1799), Gapminder v7 (1800 to 1949), UN World Population Prospects 2024 (1950 onward). Original Read: single values via Our World in Data: world figures for the years each page lists, United States and United Kingdom for a few years; all listed world years through 1950 summed as a check, not reproduced.
- Edouard Mathieu, Lucas Rodés-Guirao. “What are the sources for Our World in Data's population estimates?” Our World in Data, 2022, revised August 2024. Original Read: full article. Text license: CC BY.
- Max Roser, Hannah Ritchie, Veronika Samborska. “Two centuries of rapid global population growth will come to an end.” Our World in Data, 2023. Original Read: full article. Text license: CC BY.
- Max Roser. “Demographic transition: Why is rapid population growth a temporary phenomenon?” Our World in Data, 2023. Original Read: full article. Text license: CC BY.
- Hannah Ritchie. “How many people does synthetic fertilizer feed?” Our World in Data, 2017. Original Read: full article; Erisman et al. 2008 and other papers it cites not read. Text license: CC BY.
- Korotayev, A. & Zinkina, J. (2015). “East Africa in the Malthusian Trap? A statistical analysis of financial, economic, and demographic indicators.” arXiv:1503.08441. Original Read: preprint, opening section for the definition; the rest of the paper not used. Text license: CC BY 3.0.
- Nielsen, R. W. (2013). “Scientifically unacceptable concept of the Epoch of Malthusian Stagnation.” arXiv:1310.4258, a preprint. Original Read: preprint, title, abstract and the section describing the concept.
Cite this page
The What-If Observatory. "Malthus: His 512 to 10, People to Food, Had No Date." Published 2026-11-09. https://whatifobservatory.com/old-forecasts/malthus/. Add the date you read it.
Corrections
None so far.