How Many People Have Ever Lived to 2022? About 117B, Modeled
The What-If Observatory Published
About 117 billion people were born through 2022, by a Population Reference Bureau model, and nobody counted them. Our rougher second road gets 58.5 billion since 10,000 BCE, and about 65 billion back to 190,000 BCE once we add a guessed prehistory. Those central figures land 2 times apart or less, and swapping in that model's birth rates closes more than half of that gap. Our test cases run from about 50 to about 117 billion.
Steps in this reading (6)
- Suppose:
- every human birth since 190,000 BCE got one tally mark.
- Hold fixed:
- a 2022 cutoff, the 190,000 BCE start date, births rather than deaths.
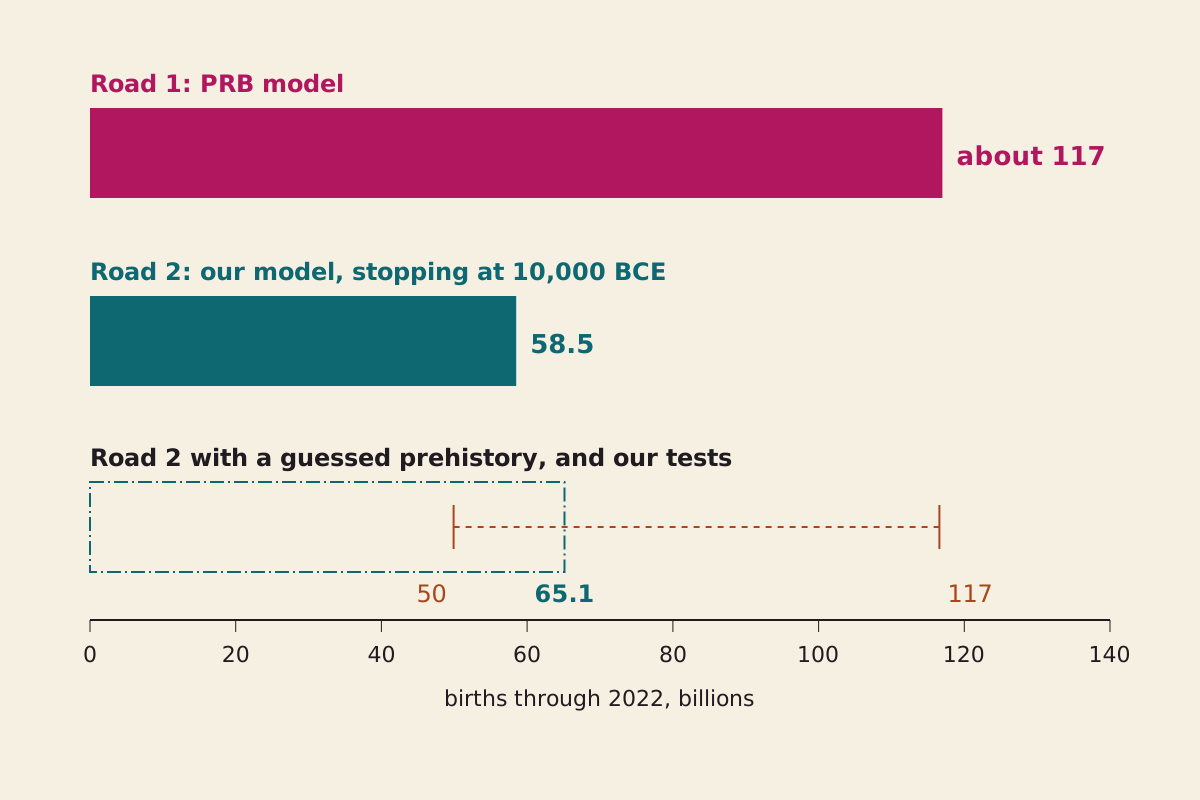
Two roads to one number, both through 2022. Road 1 is a published model. Road 2 is ours, shown without and then with a guessed prehistory, along with the range of our test cases.
"Two roads to the number of people ever born" by The What-If Observatory, https://whatifobservatory.com/estimates/how-many-people-have-ever-lived/, licensed under CC BY 4.0 (https://creativecommons.org/licenses/by/4.0/)
Data: PRB 2022; OWID (HYDE 3.3, Gapminder v7, UN WPP 2024); upstream via Our World in Data not traced back
Each step below carries a Seeing mark, a term from astronomy, where restless air limits how sharp a view can get. Here it rates how much weight a step can bear, on a scale of clear, hazy or overcast, while the table at the end checks the arithmetic separately.
Why isn't this number counted?
Records cover almost none of the time. By the Population Reference Bureau's (PRB) account, more than 99 percent of human existence left no demographic data at all, which leaves every total resting on assumptions.
The series we could read tell the same story. The long-run population series at Our World in Data starts at 10,000 BCE, which covers 6.3 percent of the 192,022 years from PRB's start date through 2022, counting both end years. Its annual United Nations figures start in 1950, so they cover 73 years, or 0.04 percent of the span.
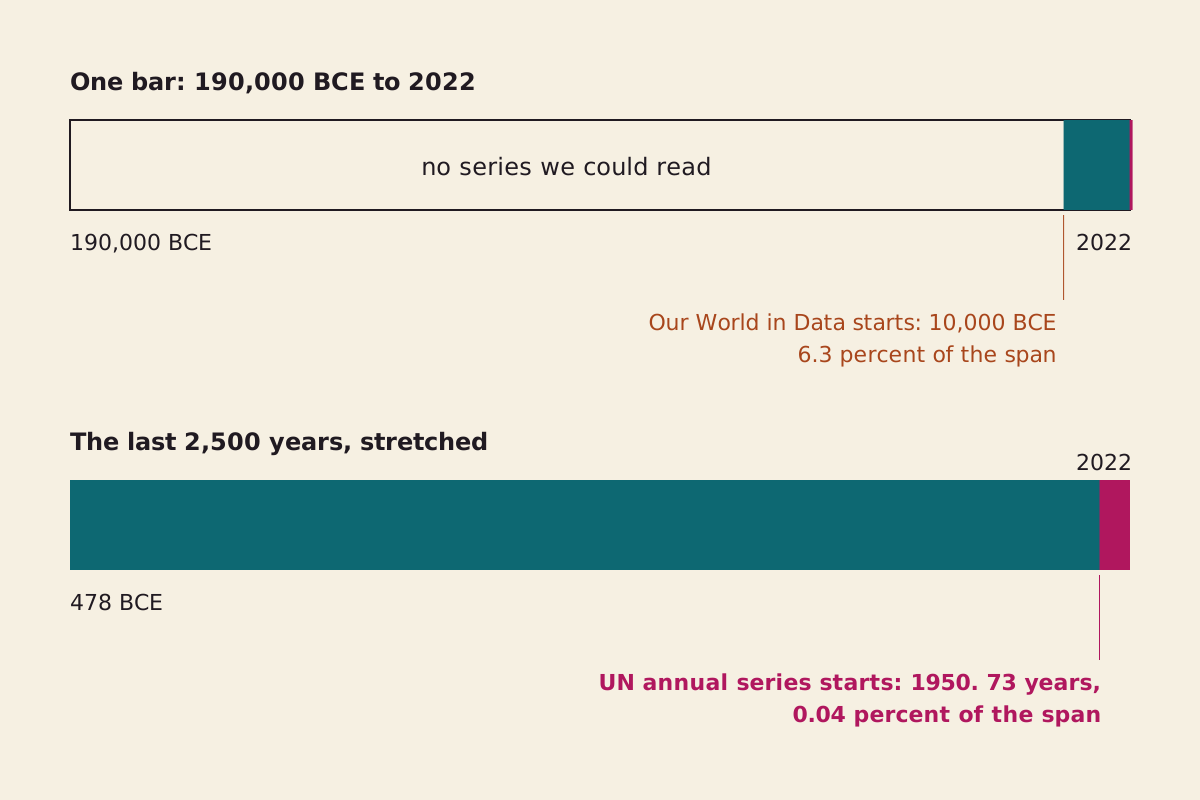
How much of the span each series covers. The lower bar stretches the last 2,500 years, because the UN's 73 years would be too thin to see at full scale.
"How much of the span has a data series" by The What-If Observatory, https://whatifobservatory.com/estimates/how-many-people-have-ever-lived/, licensed under CC BY 4.0 (https://creativecommons.org/licenses/by/4.0/)
 Illustration
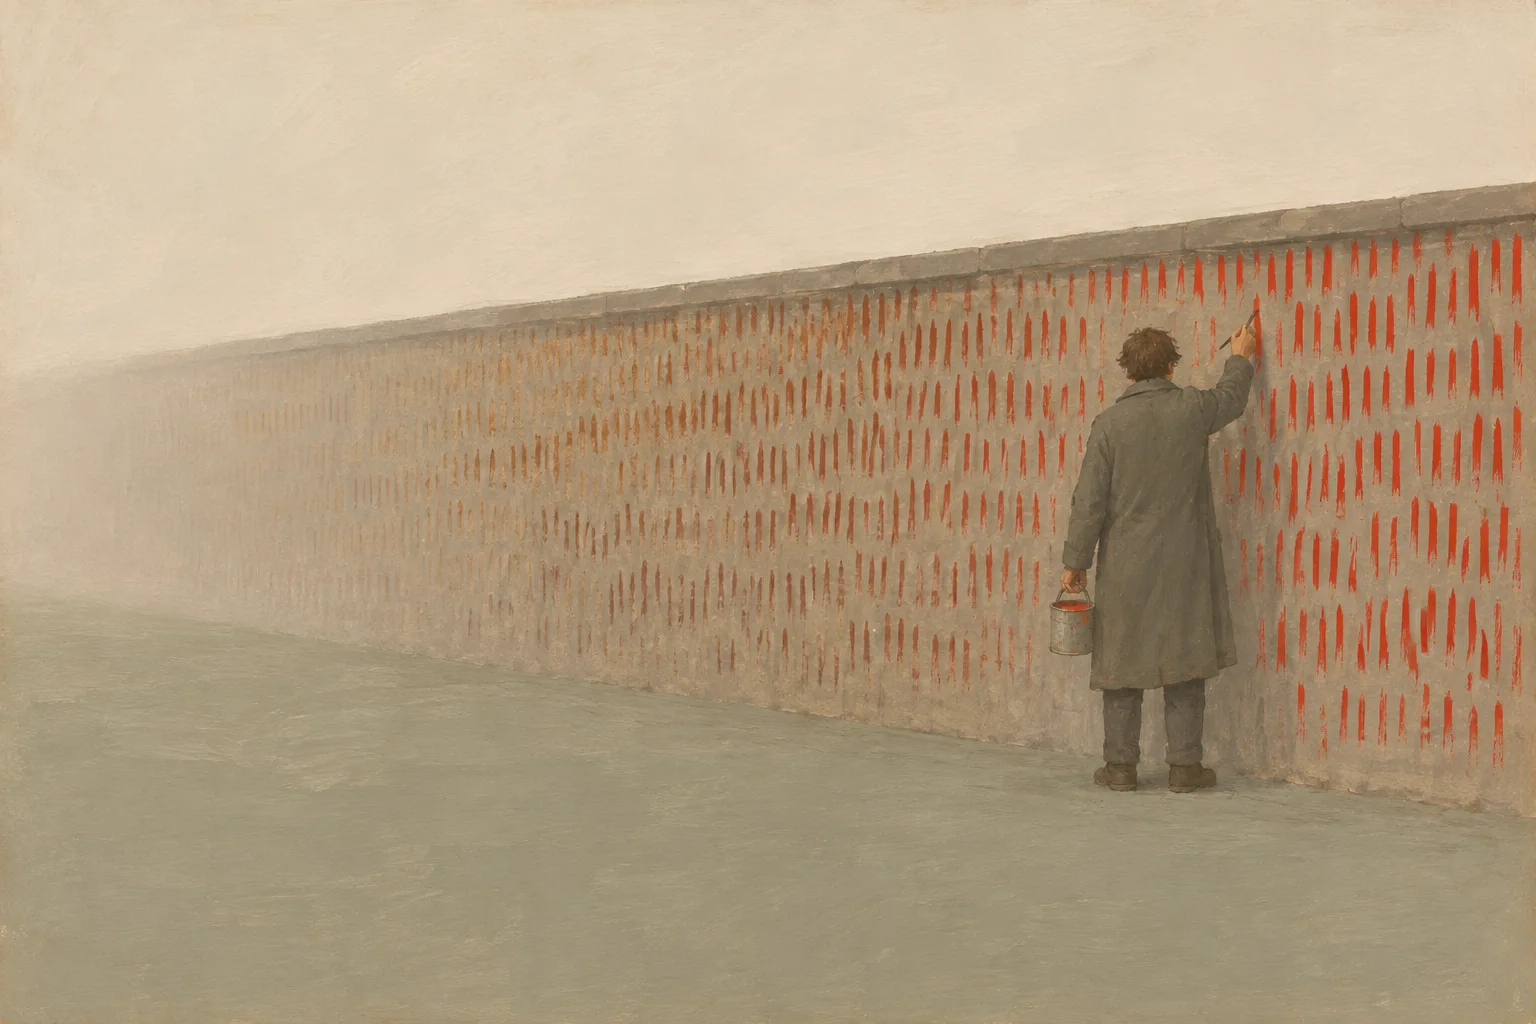
Every human birth as one tally mark, a count nobody could finish. Not to scale.
Illustration: The What-If Observatory. Generated schematic illustration — not a photograph or historical record. © The What-If Observatory, all rights reserved.
Nobody can know the total, at least not as a tally. The only option is an estimate built from three inputs that PRB names: how long humans have been here, how many were alive in each period, and how many babies each 1,000 people had per year. Deaths never enter the sum, because everyone who died was first born.
Road 1: PRB's model
Step 1: the published figure. Toshiko Kaneda of PRB and Carl Haub, a former PRB demographer, put the total at about 117 billion births through 2022, in an article dated November 15, 2022. That total is PRB's, and this page reports it without rebuilding it. We use only their conclusion and the assumptions they state in words, and their period-by-period table stays on their page.
Where to begin is a choice in itself. PRB notes that the oldest hominins may date to 7 million BCE and the earliest members of the genus Homo to between 2 million and 1.5 million BCE, but it starts at 190,000 BCE, the date it gives for modern Homo sapiens. It begins with just two people. The authors concede that this is unlikely and only a simplification.
Between their population benchmarks, they assume constant growth. They set the birth rate at 80 per 1,000 people per year through 1 CE and 60 per 1,000 from then to 1750, with lower rates after that.
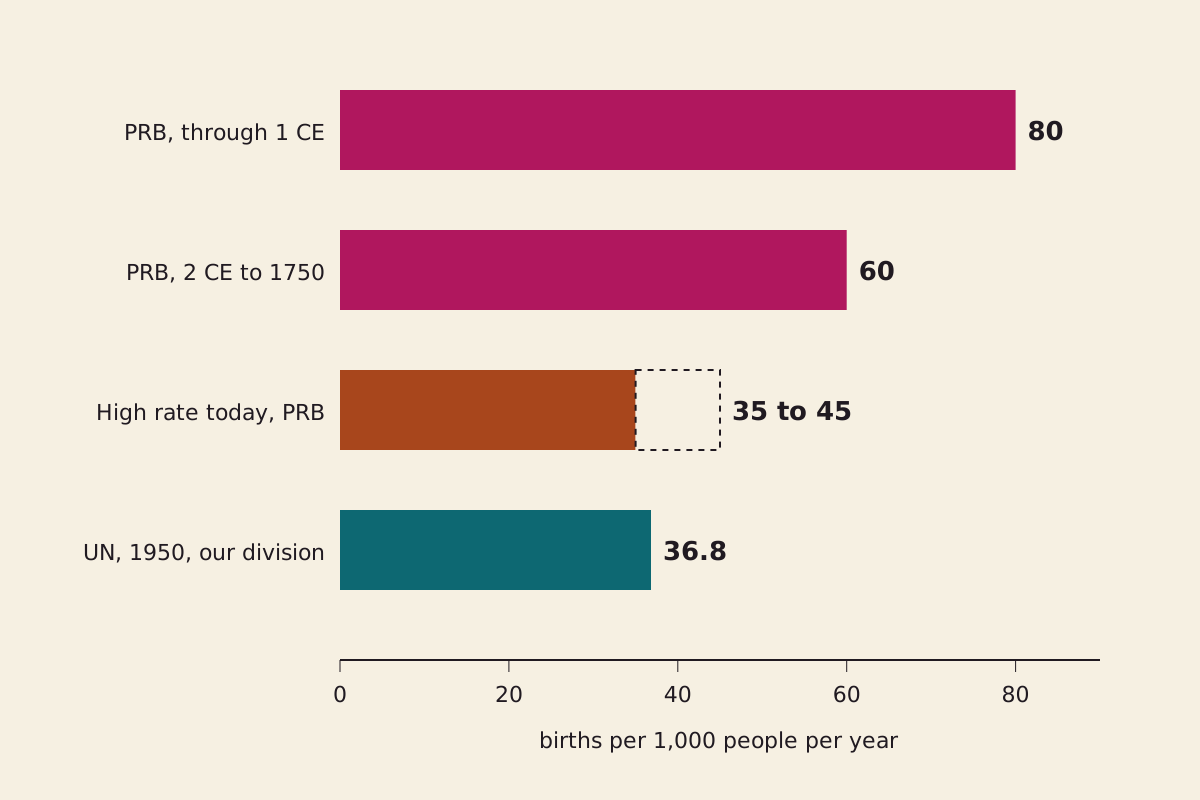
The birth rates in play. The top two bars are PRB's assumptions. The third is PRB's description of a high rate today. The fourth is our own division of two UN figures for 1950.
"Birth rates used by each road" by The What-If Observatory, https://whatifobservatory.com/estimates/how-many-people-have-ever-lived/, licensed under CC BY 4.0 (https://creativecommons.org/licenses/by/4.0/)
Data: PRB 2022; OWID (UN WPP 2024); upstream via Our World in Data not traced back
Why 80? PRB reasons that for most of human history, people probably lived about 10 years on average from birth, and that a species living so briefly needs roughly that birth rate to survive. For comparison, it describes a high birth rate today as about 35 to 45.
The population figures are soft as well. PRB cites one estimate of 45 million people for the Roman Empire in 14 CE, then adds that other historians double it. It also warns which way its error may run: assuming steady growth rather than wild swings may understate the average population, so the method may undercount births. Seeing: hazy.
Road 2: our model
Our road uses different population figures and one flat birth rate, and it runs backward from the years with the firmest numbers.
Step 2: add the UN's births. Our World in Data carries annual world births from the UN's World Population Prospects 2024, and as of November 2026 those 73 values from 1950 to 2022 add up to 9.3 billion. The cutoff matters little, since the 132 million births of 2022 equal only about 0.11 percent of 117 billion. Seeing: hazy, because these estimates reach us through Our World in Data, and we did not trace them back to the UN.
Step 3: pick a rate and carry it back. For 1950, the UN figures at Our World in Data give 91.8 million births and 2.49 billion people, or 36.8 births per 1,000, and we hold that rate flat for every earlier year.
If a population holds steady for generations, with its birth and death rates unchanged, 1,000 divided by that rate gives an average life of about 27 years, while PRB's 80 means 12.5. Seeing: hazy, because the flat rate is our assumption and it moves the result a lot.
Step 4: 1800 to 1949. Our World in Data takes this stretch from Gapminder, which has 983 million people in 1800 and 1.63 billion in 1900. With steady growth between those two figures, the average is 1.28 billion, and that average times the rate times 100 years gives 4.7 billion births for the century. Adding the years from 1900 to 1949, which end at the UN figure for 1950, brings the block to 8.4 billion. Seeing: hazy.
Step 5: 1 CE to 1799. The population here comes from HYDE, a historical database, through Our World in Data. It has 232 million people at its entry for year 0, where PRB has 300 million for 1 CE. This stretch ends at Gapminder's figure for 1800, and the same sum gives 25.2 billion. Seeing: hazy.
Step 6: 10,000 BCE to 1 CE. HYDE starts this stretch with 4.5 million people, and the same sum gives 15.6 billion. Seeing: hazy.
Steps 4 to 6 use ten population figures, listed in the CSV, and we did not trace them back to HYDE, Gapminder or the UN. Running the same sum through all 188 figures the series lists up to 1950 gives a Road 2 of 57.4 billion, so that choice moves the total by less than 2 percent.
Between two population figures, neither road can see a plague or a famine, because steady growth smooths such events away. PRB points to the Black Death and to a plague in the sixth century as reasons why large swings make any estimate of this kind harder.
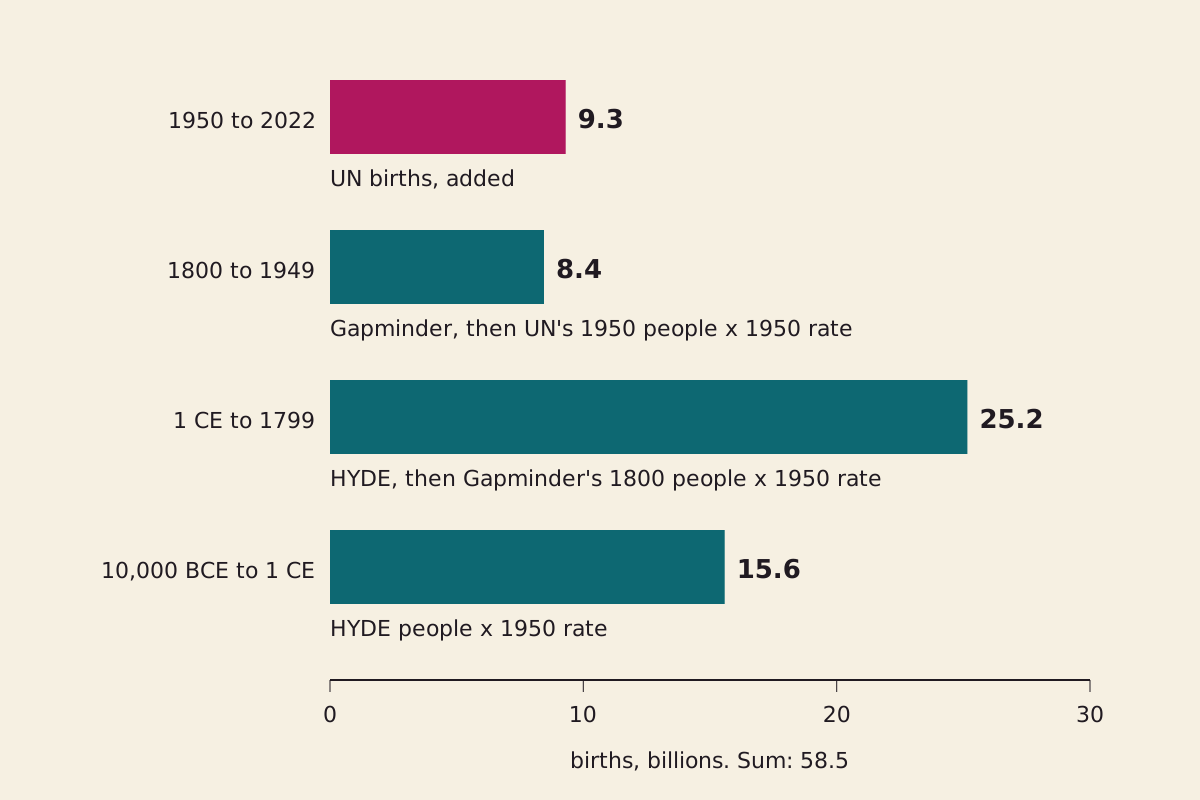
Road 2 in four blocks. Only the first adds up annual birth estimates. The other three multiply population figures by the 1950 birth rate, and two of them end at the next series' first figure.
"Road 2 births by block" by The What-If Observatory, https://whatifobservatory.com/estimates/how-many-people-have-ever-lived/, licensed under CC BY 4.0 (https://creativecommons.org/licenses/by/4.0/)
Data: OWID (HYDE 3.3, Gapminder v7, UN WPP 2024); upstream via Our World in Data not traced back
Step 3 is the soft spot, so here is the sum again with only that rate changed.
| Flat rate before 1950, per 1,000 | Births since 10,000 BCE | Road 1 is this many times higher |
|---|---|---|
| 30 | 49.4 billion | 2.37 |
| 36.8 | 58.5 billion | 2.00 |
| 50 | 76.1 billion | 1.54 |
| 60 | 89.4 billion | 1.31 |
| 80 | 116.1 billion | 1.01 |
The last row is not PRB's model. It applies 80 all the way to 1950 and leaves out everything before 10,000 BCE, so its closeness to 117 billion is a coincidence of the sum.
How far apart are the roads?
Step 7: the gap. Road 2 reaches 58.5 billion, so Road 1 is 2.00 times higher, even though Road 2 skips the first 180,000 years. Adding births from those years narrows the gap at first. To push Road 2 three times above Road 1, the world would need a flat 44 million people for all 180,000 years, about 10 times the HYDE figure for 10,000 BCE.
So we claim two-road agreement, our name for two estimates within 3 times of each other, with main inputs from different sources. Seeing: hazy.
That label shows that the roads are consistent, not that they are right. Both assume steady growth between population figures, both multiply by an assumed birth rate, and both lean on the UN after 1950, in different revisions. PRB says its early figures average ranges from the UN and other sources, and we could not trace whether HYDE draws on the same older estimates.
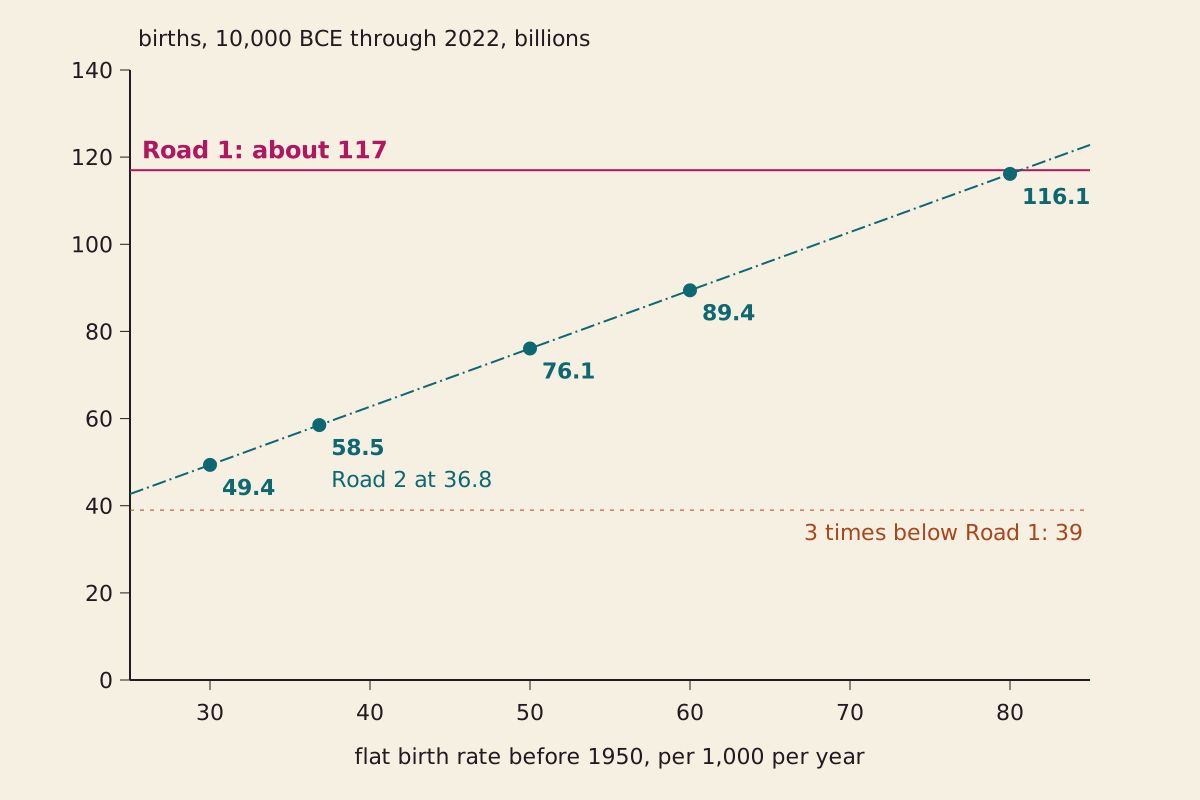
Road 2, counted through 2022, stays inside 3 times of Road 1 at every rate we tested, even with no births before 10,000 BCE. The line is straight because births before 1950 scale with the rate.
"Road 2 as the flat birth rate changes" by The What-If Observatory, https://whatifobservatory.com/estimates/how-many-people-have-ever-lived/, licensed under CC BY 4.0 (https://creativecommons.org/licenses/by/4.0/)
Data: PRB 2022; OWID (HYDE 3.3, Gapminder v7, UN WPP 2024); upstream via Our World in Data not traced back
Step 8: what causes the gap? Keep our population figures and swap in PRB's rates, using 80 before 1 CE and 60 up to 1800, though PRB stops using 60 at 1750. Road 2 rises from 58.5 to 92.6 billion, which closes 58 percent of the gap, and the rest would have to come from PRB's extra 180,000 years, its different population figures and its own later rates. Seeing: hazy.
On this one swap, the biggest piece of the gap is how often people gave birth, in eras with no birth records.
Other pages run into related trouble. On the Fermi paradox, our two roads land at least 3.3 times apart and earn no such label. The Great Pyramid's block count raises a different problem, a famous number that may be a division. Malthus's ratio is another sum built on steady growth.
What share is alive now?
Step 9: do the living outnumber the dead? No, on either road.
PRB counts 7.963 billion people alive in mid-2022, which is 6.8 percent of about 117 billion, or nearly 7 percent in its own words. That leaves about 13.7 people who have died for each person alive.
Road 2 gives a ceiling instead. The UN figure for 2022 at Our World in Data, as of November 2026, is 8.02 billion, which would be at most 13.7 percent of births since 10,000 BCE, or at least about 6.3 people who have died for each person alive. Any births before 10,000 BCE would lower that share. Seeing: hazy.
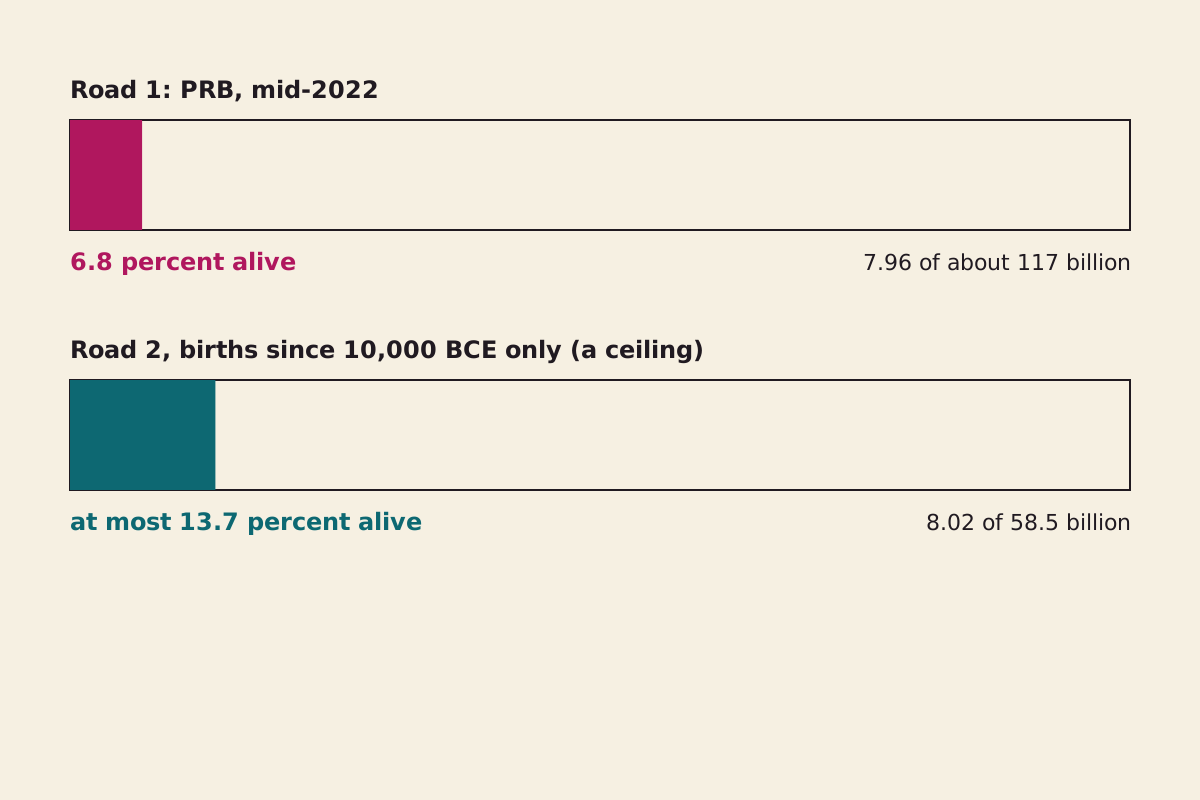
Those alive in 2022 as a share of births. The second bar is a ceiling, because it counts births only since 10,000 BCE.
"Share of those ever born who were alive in 2022" by The What-If Observatory, https://whatifobservatory.com/estimates/how-many-people-have-ever-lived/, licensed under CC BY 4.0 (https://creativecommons.org/licenses/by/4.0/)
Data: PRB 2022; OWID (HYDE 3.3, Gapminder v7, UN WPP 2024); upstream via Our World in Data not traced back
What about the years before 10,000 BCE?
Step 10: the earliest 180,000 years. No series we could read reaches them. From here on, we are guessing.
We put in a placeholder: a flat 1 million people at 36.8 births per 1,000, which gives 6.6 billion births. Road 2 becomes 65.1 billion, and Road 1 is 1.80 times higher. Seeing: overcast.
Swapping that placeholder for 100,000 people or 4.5 million moves Road 2 between 59.2 and 88.3 billion. With the rate at 30 or 50 as well, the extremes are about 50 and about 117 billion. Those are test values we chose, not limits on the true number.
PRB is in the same position. It calls the period from 190,000 BCE to 1 CE key to its estimate and says that little is known about population then, so its 117 billion also includes these years.
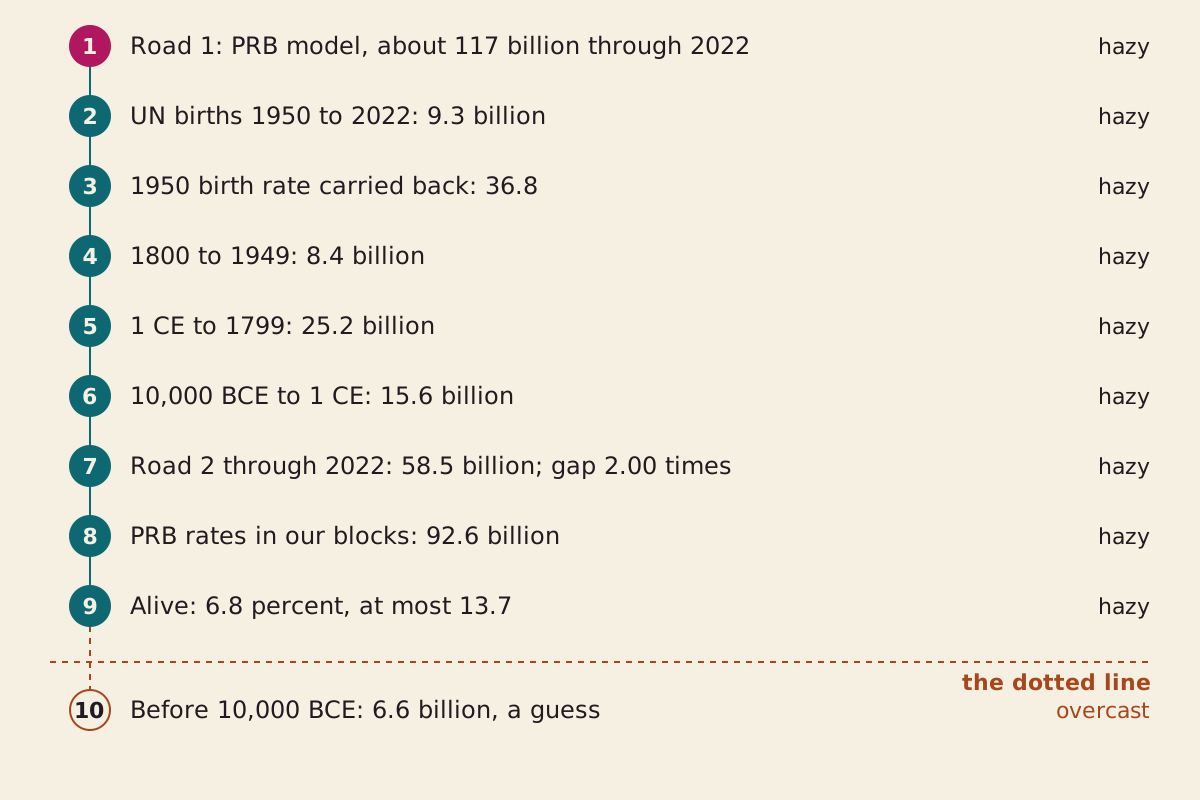
The chain behind this page, through 2022. Steps 1 to 9 rest on a published model, named population series and one stated rate. Step 10 sits past the dotted line.
"How many people have ever lived: chain of steps" by The What-If Observatory, https://whatifobservatory.com/estimates/how-many-people-have-ever-lived/, licensed under CC BY 4.0 (https://creativecommons.org/licenses/by/4.0/)
Data: OWID (HYDE 3.3, Gapminder v7, UN WPP 2024); upstream via Our World in Data not traced back
The dotted line falls after step 9. Up to there, each number has a named source or a stated assumption, and our sums were rerun. Before 10,000 BCE, neither the head count nor the birth rate has a series behind it on either road.
Check my math:
| Step | Input | Value | Unit | Source no. | Source | Recomputed | Seeing |
|---|---|---|---|---|---|---|---|
| 1 | Births since 190000 BCE, Road 1 | 117 | billion births | 1 | primary | no | hazy |
| 2 | World births 1950 to 2022 added | 9.3 | billion births | 3 | secondary | yes | hazy |
| 2 | World births in 2022 | 132,475,390 | births | 3 | secondary | no | hazy |
| 2 | Births of 2022 as a share of 117 billion | 0.11 | percent | 1, 3 | site assumption | yes | hazy |
| 3 | World births in 1950 | 91,823,940 | births | 3 | secondary | no | hazy |
| 3 | World population in 1950 | 2,493,092,852 | people | 2 | secondary | no | hazy |
| 3 | Birth rate in 1950, carried back | 36.8 | births per 1000 per year | 2, 3 | site assumption | yes | hazy |
| 4 | Births 1800 to 1900, worked example | 4.7 | billion births | 2, 3, 4 | site assumption | yes | hazy |
| 4 | Births 1800 to 1949, Road 2 | 8.4 | billion births | 2, 3, 4 | site assumption | yes | hazy |
| 5 | Births 1 CE to 1799, Road 2 | 25.2 | billion births | 2, 3, 4 | site assumption | yes | hazy |
| 6 | Births 10000 BCE to 1 CE, Road 2 | 15.6 | billion births | 2, 3, 4 | site assumption | yes | hazy |
| 7 | Road 2 births 10000 BCE to 2022 | 58.5 | billion births | 2, 3, 4 | site assumption | yes | hazy |
| 7 | Gap, with Road 2 stopping at 10000 BCE | 2.00 | times | 1, 2, 3 | site assumption | yes | hazy |
| 7 | Population before 10000 BCE at the 3-times limit | 44 | million people | 1, 2, 3 | site assumption | yes | hazy |
| 7 | Road 2 using every population figure through 1950 | 57.4 | billion births | 2, 3, 4 | site assumption | yes | hazy |
| 8 | Road 2 with PRB rates through 1800 | 92.6 | billion births | 1, 2, 3, 4 | site assumption | yes | hazy |
| 9 | Share alive, Road 1 | 6.8 | percent | 1 | primary | yes | hazy |
| 9 | World population in 2022 | 8,021,407,196 | people | 2 | secondary | no | hazy |
| 9 | Share alive ceiling, Road 2 | 13.7 | percent | 2, 3 | site assumption | yes | hazy |
| 10 | Flat population before 10000 BCE | 1 | million people | 4 | site assumption | no | overcast |
| 10 | Births 190000 to 10000 BCE, Road 2 | 6.6 | billion births | 2, 3 | site assumption | yes | overcast |
| 10 | Road 2 total, 190000 BCE to 2022 | 65.1 | billion births | 2, 3 | site assumption | yes | overcast |
| 10 | Gap, full span | 1.80 | times | 1, 2, 3 | site assumption | yes | overcast |
| 10 | Road 2 low test | 49.9 | billion births | 2, 3 | site assumption | yes | overcast |
| 10 | Road 2 high test | 116.6 | billion births | 2, 3 | site assumption | yes | overcast |
Download how-many-people-check-my-math.csv (where its values come from) Data: OWID (HYDE 3.3, Gapminder v7, UN WPP 2024); upstream via Our World in Data not traced back
Download how-many-people-road2.csv (where its values come from) Data: OWID (HYDE 3.3, Gapminder v7, UN WPP 2024); upstream via Our World in Data not traced back
One number changed, the flat population before 10,000 BCE, with the birth rate at 36.8:
| Flat population, 190,000 to 10,000 BCE | Births in that block | Road 2 total | Road 1 is this many times higher |
|---|---|---|---|
| 0.1 million | 0.7 billion | 59.2 billion | 1.98 |
| 0.5 million | 3.3 billion | 61.8 billion | 1.89 |
| 1.0 million | 6.6 billion | 65.1 billion | 1.80 |
| 2.0 million | 13.3 billion | 71.8 billion | 1.63 |
| 4.5 million | 29.8 billion | 88.3 billion | 1.32 |
Births in each block equal the rate × the average population × the years, where the average is the difference between the two population figures divided by the natural log of their ratio. That is the steady-growth average. The sums carry the 1950 rate unrounded, 36.83 to two decimals, so typing in 36.8 gives 58.4 rather than 58.5.
Units were checked, and the computed numbers in the text were compared with the CSV. Figures reported from PRB's article, such as its two early birth rates, stay in the text and are not in the CSV.
Next question:
- How many blocks are in the Great Pyramid? The count behind the Great Pyramid
- What if Malthus's ratio had held? Malthus's ratio, run forward
Sources
- Toshiko Kaneda, Carl Haub. “How Many People Have Ever Lived on Earth?” Population Reference Bureau, November 15, 2022. Original Read: full article; conclusions and stated assumptions used, period table not reproduced.
- Our World in Data. “Population” (long-run data). Upstream: HYDE 3.3 (10,000 BCE to 1799), Gapminder v7 (1800 to 1949), UN World Population Prospects 2024 (1950 onward). Original Read: single values via Our World in Data: world figures for the years each page lists, United States and United Kingdom for a few years; all listed world years through 1950 summed as a check, not reproduced.
- Our World in Data. “Number of births, by world region.” Upstream: UN World Population Prospects 2024. Original Read: single value via Our World in Data: world births per year, 1950 to 2022, summed and not reproduced.
- Edouard Mathieu, Lucas Rodés-Guirao. “What are the sources for Our World in Data's population estimates?” Our World in Data, 2022, revised August 2024. Original Read: full article. Text license: CC BY.
- European Southern Observatory. “Adaptive Optics.” Original Read: full page. Text license: CC BY 4.0.
Cite this page
The What-If Observatory. "How Many People Have Ever Lived to 2022? About 117B, Modeled." Published 2026-11-09. https://whatifobservatory.com/estimates/how-many-people-have-ever-lived/. Add the date you read it.
Corrections
None so far.