Fermi Paradox: Voyager-Speed Ships Could Cross the Galaxy
The What-If Observatory Published
Probably in summer 1950, at a Los Alamos lunch table, Enrico Fermi asked some version of “Where is everybody?” The Fermi paradox grew from that line: if technological civilizations are common, we should already have evidence of them. On this arithmetic, time does not look like the obstacle. A ship at Voyager 1's 16.6 km/s would cross a 100,000-light-year galaxy in about 1.8 billion years, flying straight and non-stop, and Earth is 4.54 billion years old.
Steps in this reading (5)
- Suppose:
- a ship no faster than Voyager 1 sets out to cross the Milky Way.
- Hold fixed:
- a 100,000-light-year disk, 16.6 km/s, Earth's 4.54-billion-year age, nothing faster than light.
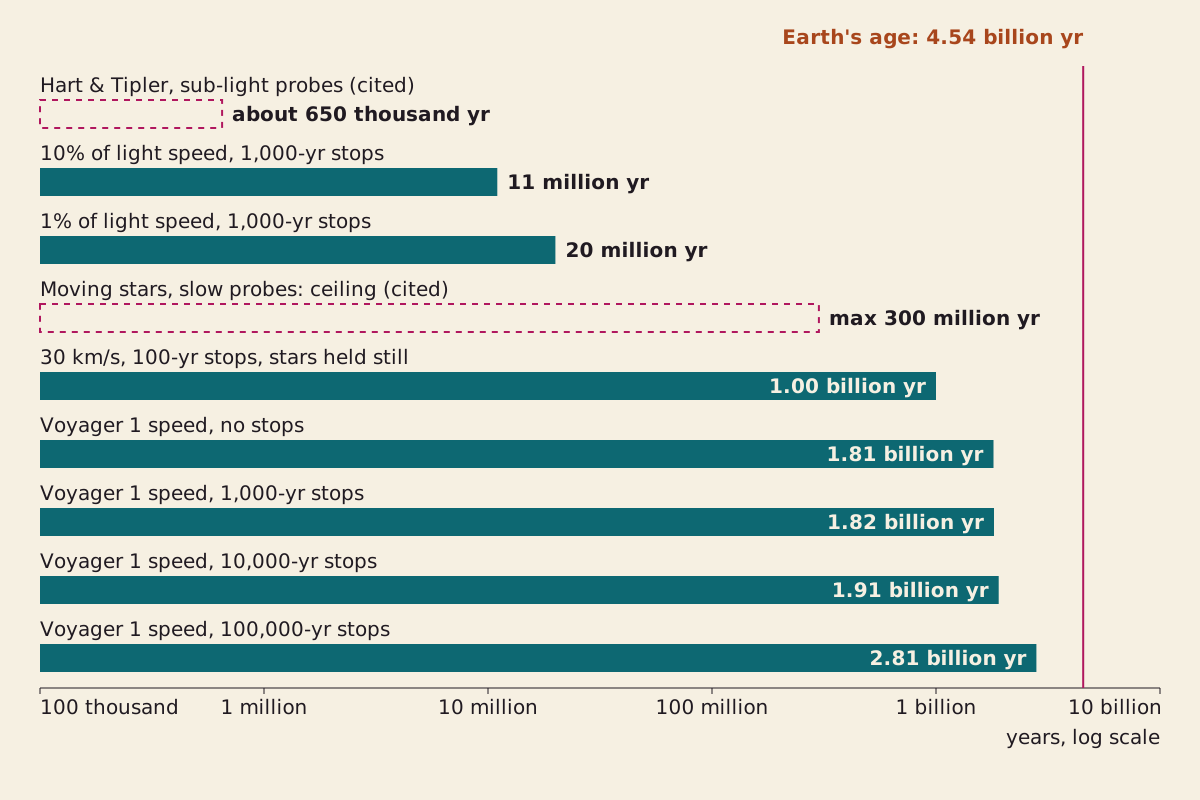
Nine ways to cross a 100,000-light-year disk, on a log scale. Solid bars are computed on this page with the stars held still. Dashed bars are published estimates we cite but did not recompute.
"Time to cross a 100,000-light-year Milky Way" by The What-If Observatory, https://whatifobservatory.com/estimates/fermi-paradox/, licensed under CC BY 4.0 (https://creativecommons.org/licenses/by/4.0/)
Data: ESO eso1811 (width); Bailer-Jones & Farnocchia 2019 (speed); Carroll-Nellenback et al. 2019 (published estimates); USGS (Earth's age); NIST (speed of light)
So on these sums, the clock looks like the easy part of Fermi's question.
Below, we rebuild that 1.8 billion one step at a time, then test it against a published model. Each step carries a Seeing mark, a label borrowed from astronomy, where unsteady air blurs fine detail. Here it rates how much weight a step can bear: clear, hazy or overcast. Whether the arithmetic itself is right is a separate check, in the table at the end.
How long would it take to cross the Milky Way at Voyager 1's speed?
About 1.8 billion years, flying straight across without stopping. Four steps get us there.
Step 1: the width. The European Southern Observatory gives the Milky Way's width as roughly 100,000 light-years, a round working figure rather than a measured edge. A light-year is the distance light travels in a year, about 9.46 trillion kilometers. We use 100,000 as our own assumption, and a wider disk would stretch every crossing time we compute below by the same factor. Seeing: hazy.
It may be wider. A 2018 study led by M. López-Corredoira found disk stars beyond 26 kiloparsecs from the center at 99.7 percent confidence, and beyond 31 at 95.4 percent. If the disk reached that far all around, it would span about 170,000 to 202,000 light-years, and the non-stop crossing would run 3.06 to 3.65 billion years.
Part of the Milky Way, from a study made in 1874–76. Chromolithograph after É. L. Trouvelot, 1881.
"Part of the Milky Way (Plate XIII, The Trouvelot Astronomical Drawings)" by É. L. Trouvelot — https://commons.wikimedia.org/wiki/File:Trouvelot_-_Part_of_the_Milky_Way.jpg — Public domain in the US (published 1881) and in the EU (author died 1895, life+70); modified: cropped to 16:9, keeping the lower sky and horizon; plate margins and printed title removed

Step 2: the speed. A 2019 paper by Coryn Bailer-Jones and Davide Farnocchia lists Voyager 1 leaving the solar system at 16.6048 kilometers per second, relative to the solar system's center of mass. Light covers exactly 299,792.458 kilometers per second, by NIST's value. Divide one by the other, and Voyager moves at about 1/18,055 of light speed, so each light-year takes it about 18,055 years. Seeing: clear.
Step 3: calibrate. An instrument gets checked on a known target before anyone trusts its readings. The same paper works out Voyager 1's flyby of Proxima Centauri: closest approach in about 16,700 years, at 3.50 light-years, with ship and star moving 43.2 kilometers per second relative to each other. Proxima is 4.243 light-years away today, by the figure P. Kervella and colleagues quote from a 1999 paper.
A right triangle then says the relative path is 2.40 light-years long. Our rule gives 2.41 for 43.2 kilometers per second over 16,700 years, a 0.14 percent miss, inside the paper's own spread of 16,500 to 16,900 years. Seeing: hazy, because the Proxima distance reaches us secondhand and the straight path is our simplification. This tests the unit conversion only and says nothing about the galaxy's width.
Step 4: the crossing. At 18,055 years per light-year, 100,000 light-years takes about 1.805 billion years. On a circular path, the Sun would need about 203 to 212 million years for one orbit of the galaxy, our own sum from the distance and two speeds in a 2016 review by Joss Bland-Hawthorn and Ortwin Gerhard. So the trip lasts about 8.5 to 8.9 of those laps. Seeing: hazy, because the width is a round figure and the trip is straight, non-stop and at constant speed.
What if the ships stop at every star?
A settler would not fly straight across. It would hop to a nearby star and stay long enough to launch again. The next two steps use our own assumptions, so the Seeing stays hazy.
Step 5: add stops. We assume hops of 10 light-years, a little over twice the distance to Proxima Centauri, with a 10,000-year stop at each star. That makes 10,000 stops, which add 100 million years, and the crossing grows to about 1.91 billion years. Seeing: hazy, because the hop and the stop are our numbers, not measurements.
Step 6: compare with Earth. Earth's age of 4.54 billion years comes from lead isotope ratios, including those in meteorites, and the US Geological Survey puts its uncertainty under 1 percent. Divide, and 2.38 crossings fit inside it. Seeing: hazy.
The table below changes one number at a time.
| Stop at each star (10-light-year hops) | Crossing at Voyager speed | Crossings that fit in Earth's age |
|---|---|---|
| none | 1.81 billion years | 2.51 |
| 1,000 years | 1.82 billion years | 2.50 |
| 10,000 years | 1.91 billion years | 2.38 |
| 100,000 years | 2.81 billion years | 1.62 |
| 273,454 years | 4.54 billion years | 1.00 |
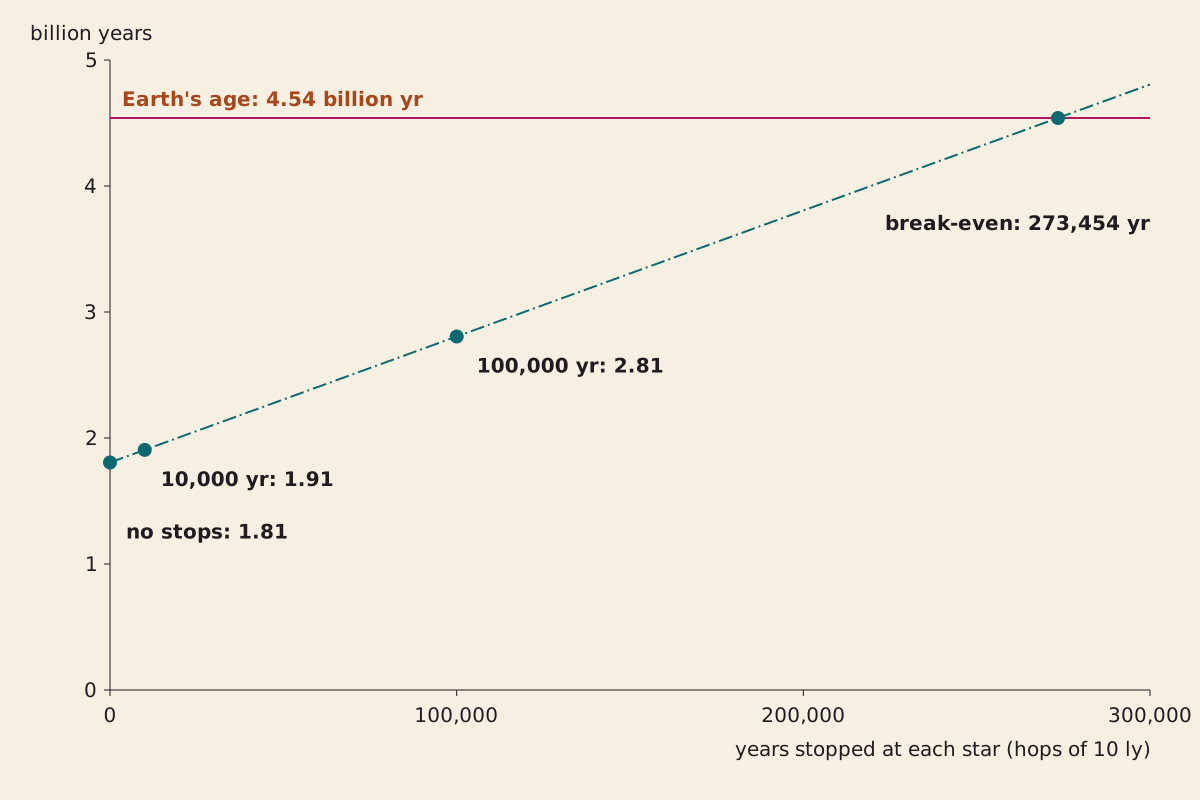
Crossing time at Voyager speed as the stop at each star lengthens, with hops of 10 light-years. The line reaches Earth's age when each stop lasts about 273,000 years.
"Crossing time against stop length at Voyager speed" by The What-If Observatory, https://whatifobservatory.com/estimates/fermi-paradox/, licensed under CC BY 4.0 (https://creativecommons.org/licenses/by/4.0/)
Data: ESO eso1811 (width); Bailer-Jones & Farnocchia 2019 (speed); USGS (Earth's age); NIST (speed of light)
Each stop would need to last about 273,000 years before the trip took as long as Earth has existed. That is longer than the roughly 181,000 years each 10-light-year hop itself takes at Voyager speed.
Faster ships shrink the clock. At 1 percent of light speed with 1,000-year stops, the crossing takes 20 million years; at 10 percent, it takes 11 million, mostly time spent at the stops. Both speeds are assumptions, not hardware anyone has built. Seeing: hazy.
Did Fermi really say “Where is everybody?”
Yes, according to three physicists who were with him, though their accounts came more than 30 years later. Eric Jones of Los Alamos National Laboratory gathered written recollections from Emil Konopinski, Edward Teller and Herbert York, and published them in a 1985 report.
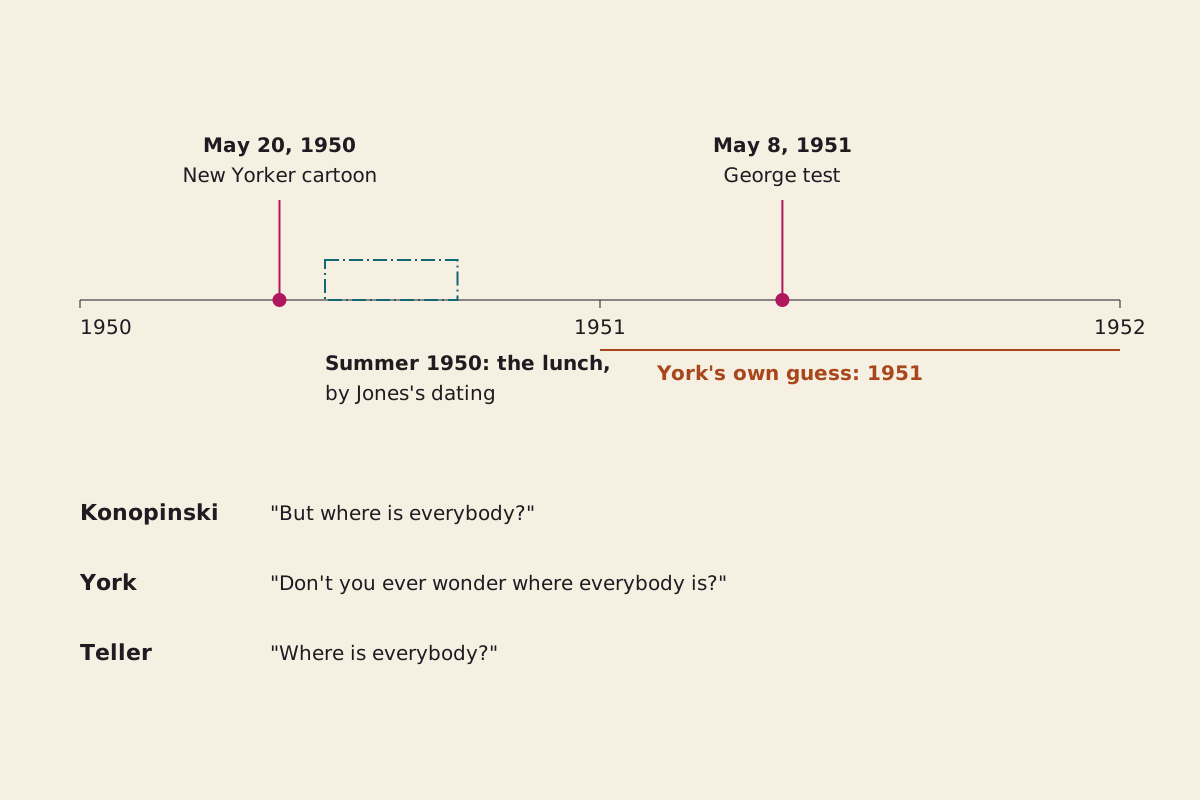
The dates Eric Jones used to place the lunch, and the three wordings he collected. Summer 1950 is his judgment from those clues.
"How the lunch was dated, and three memories of the wording" by The What-If Observatory, https://whatifobservatory.com/estimates/fermi-paradox/, licensed under CC BY 4.0 (https://creativecommons.org/licenses/by/4.0/)
Data: Jones 1985 (dates and wordings)
Their memories of the wording differ. Konopinski recalled “But where is everybody?” York remembered “Don't you ever wonder where everybody is?” and Teller remembered “Where is everybody?”
York and Teller both said everyone at the table knew Fermi meant extraterrestrials. Teller also recalled Fermi asking him, on the walk to lunch, how likely it was that within ten years we would have clear evidence of something moving faster than light. Teller said one in a million. Fermi said more like ten percent.
The date took detective work. York guessed 1951 but linked his visit to preparations for the “George” test; that test took place on May 8, 1951, so Jones read it as pointing to the summer before. Konopinski recalled a recent New Yorker cartoon coming up on the walk, and Jones traced it to Alan Dunn's drawing in the May 20, 1950, issue. Jones judged summer 1950 “quite probable.”
York also remembered Fermi running a series of probability estimates, from earthlike planets to how long technology lasts, and concluding “that we ought to have been visited long ago and many times over.” York said he was “much hazier” about what Fermi added next, on why no visit had happened. Our clock tests one part of that conclusion: whether there has been time for a visit.
How long would it take to colonize the galaxy?
The published answers we read come in far below Earth's age, with one exception. Jones summarized Michael Hart's 1975 argument: a migration would fill the galaxy “in a few million years,” a short time next to the galaxy's age, so the lack of visitors meant nobody else was out there. A 2019 paper by Jonathan Carroll-Nellenback, Adam Frank, Jason Wright and Caleb Scharf puts the Hart and Tipler crossing time at about 650,000 years.
Step 7: a second road. That paper adds something our road leaves out: the stars move. With stars drifting at about 30 kilometers per second, typical near the Sun, the authors find the crossing never takes longer than about 300 million years in their setup, whatever the probe speed. Our road, with ships at 30 kilometers per second, 100-year stops and the stars held still, gives 1.0 billion years.
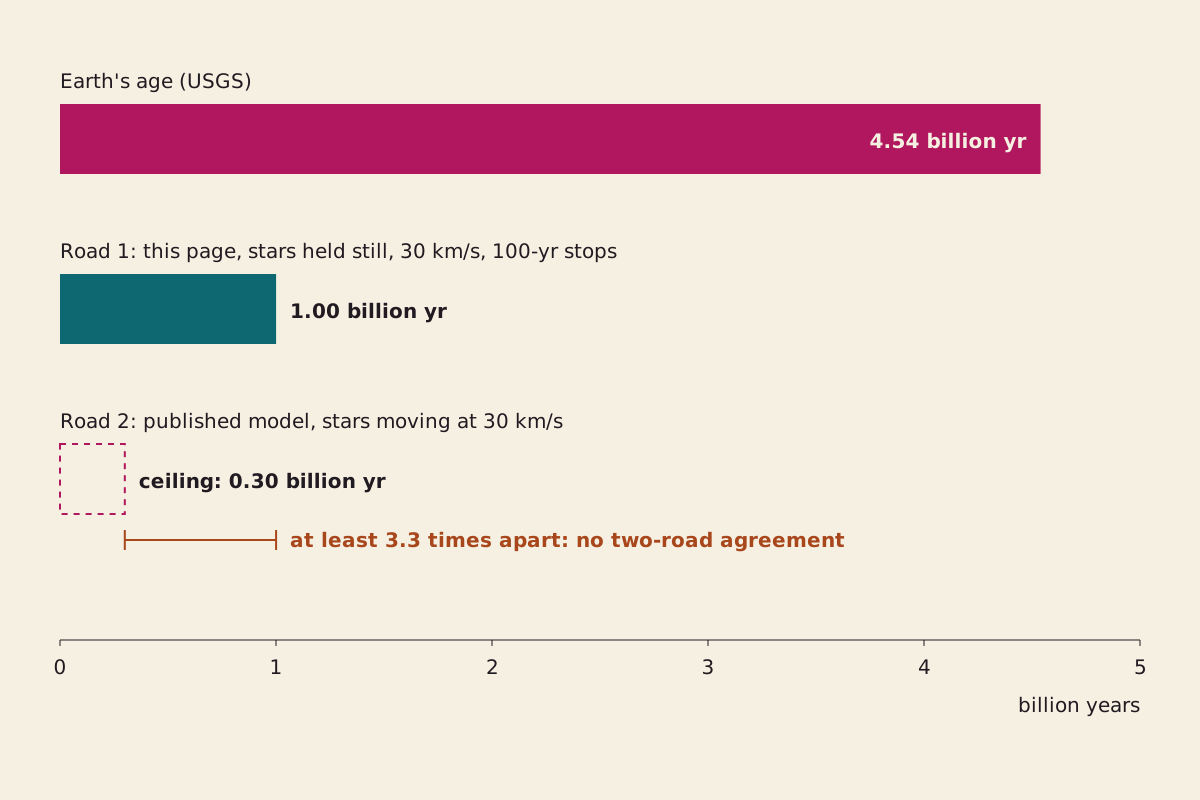
The two roads on one linear scale. Road 2 is a ceiling, so they land at least 3.3 times apart. We do not claim agreement on the number, and both sit far below Earth's age.
"Two roads to a crossing time against Earth's age" by The What-If Observatory, https://whatifobservatory.com/estimates/fermi-paradox/, licensed under CC BY 4.0 (https://creativecommons.org/licenses/by/4.0/)
Data: ESO eso1811 (width); Carroll-Nellenback et al. 2019 (Road 2); USGS (Earth's age); NIST (speed of light)
The two roads differ by at least 3.3 times, since Road 2 is only a ceiling. We claim two-road agreement, our name for two independent estimates within 3 times of each other, only when the gap is smaller. So the exact crossing time stays Seeing: overcast.
Both roads share a galaxy about 100,000 light-years wide, 100 years between launches and a civilization that keeps launching, and our road took its 30 kilometers per second from the paper's setup. So they are not independent on those inputs.
Each does land well below Earth's 4.54 billion years, but that comparison earns no mark of its own. The hazy mark on the time budget comes from step 6, where a single road at a slower 16.6 kilometers per second already fits.
The exception points the other way. In 1981, Newman and Carl Sagan found that if a civilization grows its population slowly, settling the galaxy could approach or even exceed the galaxy's age, as the 2019 paper summarizes. In our road, slow growth looks like long stops, and a Voyager-speed crossing needs stops of about 273,000 years before it outlasts Earth.
What a settled star might look like from here is a separate sum, in our Dyson sphere estimate.
Is the Fermi paradox really a paradox?
Not in the strict sense, R. A. Freitas argued in 1985, as the 2019 paper summarizes. The argument quietly assumes that someone would launch probes, and that those probes would still be here for us to notice.
We read the question the same way. Before hunting for an answer, check what the question assumes. Any non-stop ship faster than about 6.6 kilometers per second crosses the disk within Earth's age, while motive and staying power have no measured input at all.
Carroll-Nellenback and colleagues reach a similar place from the modeling side. Their abstract says the results “break the link” between Hart's “Fact A,” no interstellar visitors on Earth now, and the conclusion that humans must be the only technological civilization in the galaxy. The same abstract says two of their steady-state results point to ways in which “Earth might remain unvisited in the midst of an inhabited galaxy.”
Other named paradoxes get the same reading, among them Schrödinger's cat.
The dotted line falls after step 7. Up to there, every reading has a named source or a stated assumption, and the arithmetic was checked against a published flyby. Step 8 asks whether anyone set out and kept launching for millions to billions of years, and no measurement pins that down. From here on, we are guessing.
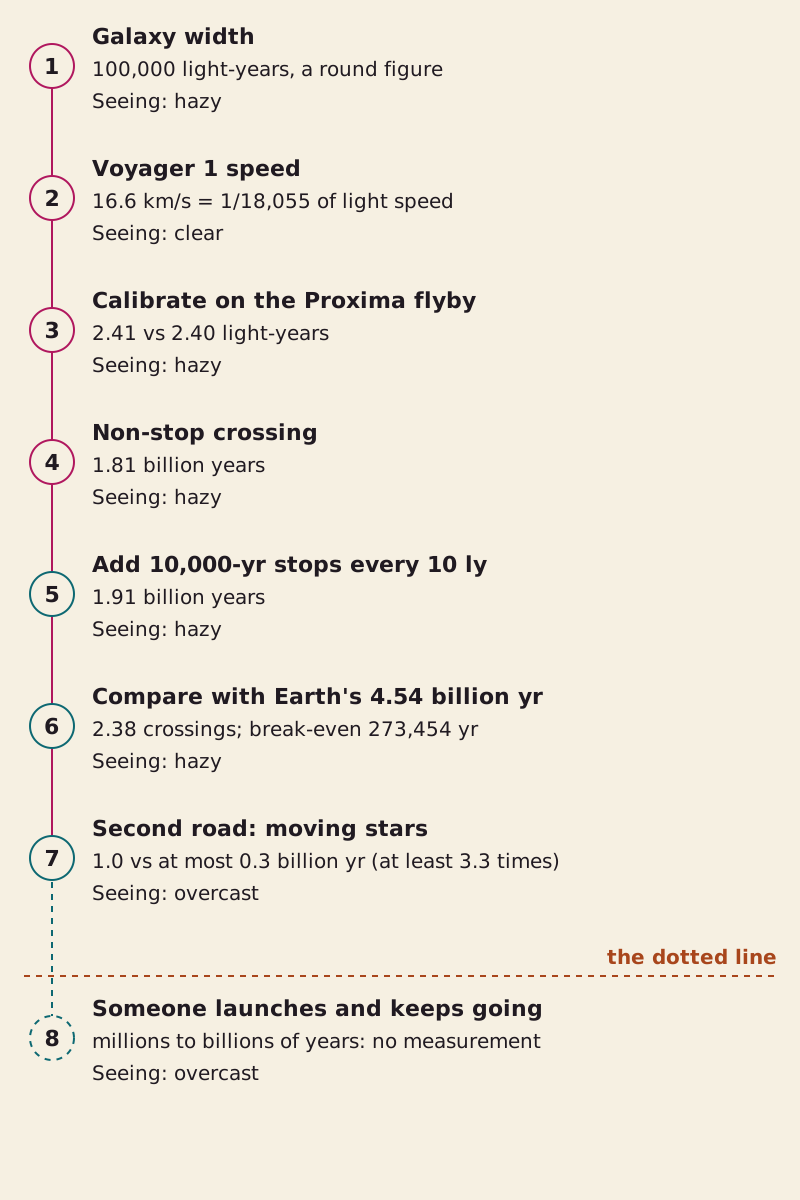
The chain behind this page. Steps 1 to 4 rest on published inputs and one round working figure. Steps 5 to 7 add our own assumptions and a second road. Step 8 sits past the dotted line.
"Fermi paradox crossing-time chain" by The What-If Observatory, https://whatifobservatory.com/estimates/fermi-paradox/, licensed under CC BY 4.0 (https://creativecommons.org/licenses/by/4.0/)
So the clock sits above that line, and the motive sits below it. Seeing: overcast.
Check my math:
| Step | Input | Value | Unit | Source no. | Source | Recomputed | Seeing |
|---|---|---|---|---|---|---|---|
| 1 | Milky Way width | 100,000 | ly | 3 | site assumption | no | hazy |
| 1 | One light-year: light speed × Julian year | 9.4607 × 10¹² | km | 9 | primary | yes | clear |
| 2 | Voyager 1 speed | 16.6048 | km/s | 5 | primary | no | clear |
| 2 | Speed of light | 299,792.458 | km/s | 9 | primary | no | clear |
| 2 | Years per light-year: c ÷ v | 18,054.6 | yr/ly | 5, 9 | primary | yes | clear |
| 3 | Proxima Centauri today | 4.243 | ly | 6 | secondary | yes | hazy |
| 3 | Flyby closest approach | 3.50 | ly | 5 | primary | yes | clear |
| 3 | Relative path from the triangle | 2.403 | ly | 5, 6 | secondary | yes | hazy |
| 3 | Same path: 43.2 km/s × 16,700 yr | 2.406 | ly | 5, 9 | primary | yes | clear |
| 4 | Non-stop crossing | 1.8055 × 10⁹ | yr | 3, 5, 9 | site assumption | yes | hazy |
| 4 | One solar orbit, if circular, at two speeds | 203 to 212 | Myr | 7 | secondary | yes | hazy |
| 4 | Crossing in solar orbits | 8.5 to 8.9 | orbits | 3, 5, 7, 9 | site assumption | yes | hazy |
| 5 | Hop length | 10 | ly | 6 | site assumption | no | hazy |
| 5 | Stop length | 10,000 | yr | — | site assumption | no | hazy |
| 5 | One 10-ly hop at Voyager speed | 180,546 | yr | 5, 9 | site assumption | yes | hazy |
| 5 | Number of stops | 10,000 | stops | 3 | site assumption | yes | hazy |
| 5 | Crossing with stops | 1.9055 × 10⁹ | yr | 3, 5, 9 | site assumption | yes | hazy |
| 6 | Earth's age | 4.54 × 10⁹ | yr | 8 | primary | no | clear |
| 6 | Crossings in Earth's age | 2.38 | crossings | 3, 5, 8, 9 | site assumption | yes | hazy |
| 6 | Break-even stop length | 273,454 | yr | 3, 5, 8, 9 | site assumption | yes | hazy |
| 6 | Slowest non-stop speed that fits | 6.60 | km/s | 3, 8, 9 | site assumption | yes | hazy |
| 7 | Road 1 at 30 km/s, 100-yr stops, stars held still | 1.0003 × 10⁹ | yr | 2, 3, 9 | site assumption | yes | overcast |
| 7 | Road 2 ceiling, moving stars | 3.0 × 10⁸ | yr | 2 | primary | no | overcast |
| 7 | Road gap, lower bound | at least 3.33 | times | 2, 3, 9 | site assumption | yes | overcast |
| 8 | Someone keeps launching for millions to billions of years | — | — | — | site assumption | no | overcast |
Download fermi-paradox-check-my-math.csv (where its values come from)
Download fermi-paradox-crossing-scenarios.csv (where its values come from)
One number changed, the galaxy's width, with the ship still non-stop at Voyager speed:
| Galaxy width | Non-stop crossing | Crossings that fit in Earth's age |
|---|---|---|
| 100,000 ly | 1.81 billion years | 2.51 |
| 169,601 ly | 3.06 billion years | 1.48 |
| 202,217 ly | 3.65 billion years | 1.24 |
| 251,460 ly | 4.54 billion years | 1.00 |
Light-years here use the Julian year, so a crossing time in years equals light-years × (light speed ÷ ship speed). Units were checked, and the computed numbers in the text were compared with the CSV.
Next question:
- How many people have ever lived? Everyone ever born, counted two ways
- What if the Moon came closer? The Moon at half its distance
Sources
- Eric M. Jones, Los Alamos National Laboratory. “‘Where Is Everybody?’ An Account of Fermi’s Question.” Report LA-10311-MS, March 1985. Original Read: full text, last read 2026-10-07.
- Jonathan Carroll-Nellenback, Adam Frank, Jason Wright, Caleb Scharf (2019). “The Fermi Paradox and the Aurora Effect: Exo-civilization Settlement, Expansion, and Steady States.” The Astronomical Journal 158(3):117. arXiv:1902.04450. Original Read: preprint, full text.
- European Southern Observatory. “SPHERE Reveals Fascinating Zoo of Discs Around Young Stars.” Press release eso1811, 2018. Original Read: press release, one sentence on the galaxy's width. Text license: CC BY 4.0.
- M. López-Corredoira, C. Allende Prieto, F. Garzón, H. Wang, C. Liu, L. Deng (2018). “Disk stars in the Milky Way detected beyond 25 kpc from its center.” Astronomy & Astrophysics 612:L8. arXiv:1804.03064. Original Read: preprint, abstract.
- Coryn A. L. Bailer-Jones, Davide Farnocchia (2019). “Future stellar flybys of the Voyager and Pioneer spacecraft.” Research Notes of the American Astronomical Society 3:59; extended version, arXiv:1912.03503. Original Read: preprint (extended version), Table 1 and its notes.
- P. Kervella, F. Thévenin, C. Lovis (2017). “Proxima’s orbit around Alpha Centauri.” Astronomy & Astrophysics 598:L7. arXiv:1611.03495. Original Read: preprint, introduction.
- Joss Bland-Hawthorn, Ortwin Gerhard (2016). “The Galaxy in Context: Structural, Kinematic and Integrated Properties.” Annual Review of Astronomy and Astrophysics 54:529–596. arXiv:1602.07702. Original Read: preprint, sections on the solar orbit.
- U.S. Geological Survey. “Geologic Time: Age of the Earth.” Original Read: full page.
- National Institute of Standards and Technology. “CODATA Value: speed of light in vacuum” (2022 CODATA recommended values). Original Read: value page, last read 2026-10-07.
- European Southern Observatory. “Adaptive Optics.” Original Read: full page. Text license: CC BY 4.0.
Cite this page
The What-If Observatory. "Fermi Paradox: Voyager-Speed Ships Could Cross the Galaxy." Published 2026-11-09. https://whatifobservatory.com/estimates/fermi-paradox/. Add the date you read it.
Corrections
None so far.