Kardashev Scale: 2022 Energy Use Is About 5x the 1964 Type I
The What-If Observatory Published
Kardashev's 1964 Type I sat near Earth's own level at the time, as Milan Ćirković quotes the definition. The Kardashev scale ranks civilizations by energy use, and that rung works out to about 4 trillion watts, though later versions moved it to 10,000 trillion or more. Humanity used about 20 trillion in 2022, which is five times the 1964 Type I and only about 0.73 on Carl Sagan's formula.
Steps in this reading (5)
- Suppose:
- you rate a civilization by its power use alone.
- Hold fixed:
- Sagan's 1973 formula; world energy for 2022, about 600 quadrillion Btu by the US Energy Information Administration.
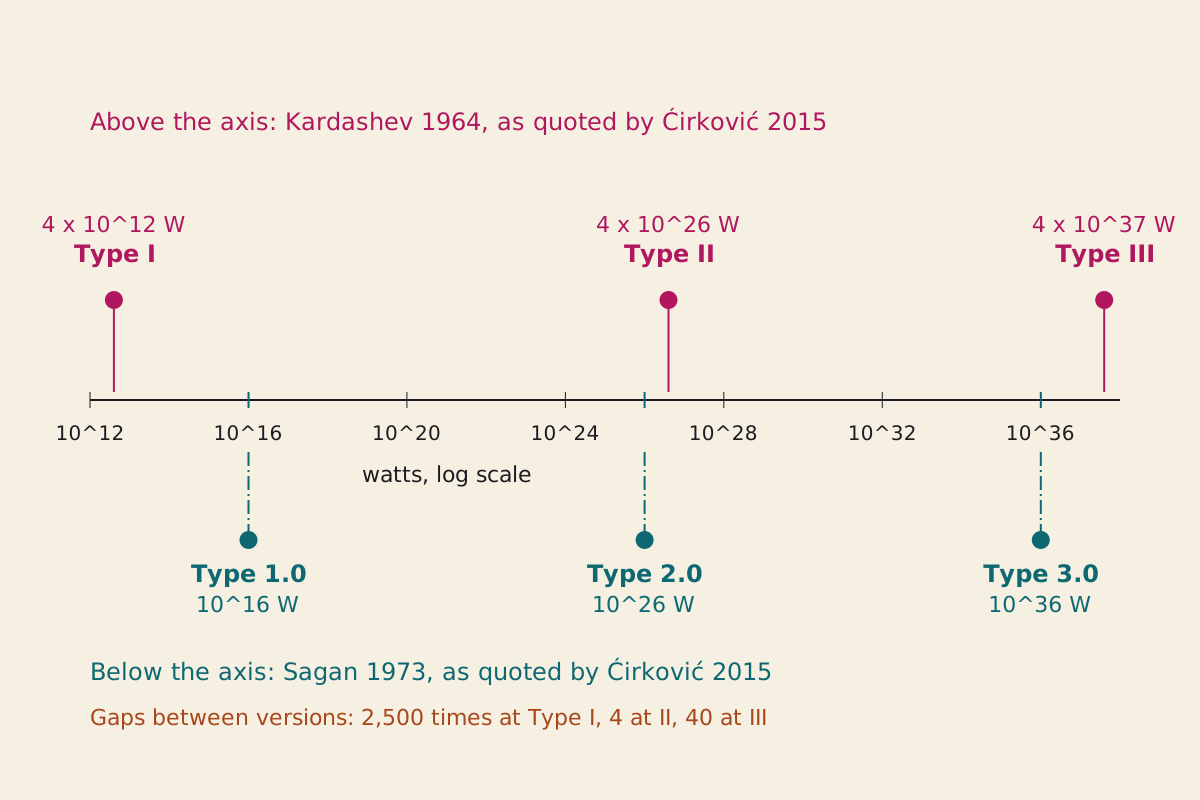
Both versions of the scale on one log axis. They nearly meet at Type II and sit 2,500 times apart at Type I.
"Kardashev's three types and Sagan's on one log axis" by The What-If Observatory, https://whatifobservatory.com/estimates/kardashev-scale/, licensed under CC BY 4.0 (https://creativecommons.org/licenses/by/4.0/)
So “what type are we?” has more than one answer: it depends on whose Type I you use.
Each step below carries a Seeing mark, a term borrowed from astronomy, where calm air gives a steadier view. On this page it rates how much weight a step can bear, on a scale of clear, hazy or overcast, and the table at the end checks the arithmetic separately.
What did Kardashev write?
Nikolai Kardashev, a Russian astrophysicist, sorted technological civilizations into three types in a 1964 paper. We could not read that paper, so every word of his on this page comes through Ćirković's 2015 review, which quotes the list.
Step 1: his numbers. Type I is a level “close to the level presently attained on the earth,” using about 4 × 10^19 ergs per second, and since one erg per second is 10^-7 watts, that comes to 4 × 10^12 watts (Ćirković, sec. 1). Type II, at 4 × 10^26 watts, draws on the output of its own star. Type III, at 4 × 10^37 watts, commands energy on the scale of its galaxy. Seeing: hazy, because the list reaches us secondhand.
The rungs are unevenly spaced. Type II is 100 trillion times Type I, while Type III is only 100 billion times Type II, which already suggests these figures describe rough classes of object and not a measured ladder.
A Dyson sphere is Kardashev's own example of Type II: the quoted list names the “Dyson sphere” as one case of that stage (sec. 1). Our Dyson sphere estimate asks what building one would involve.
Step 2: was that really Earth's level? The 4 trillion is his figure, not a measured total, and the review shows no working for it, so we compared it with a later reconstruction. Vaclav Smil's estimates, as Our World in Data lists them, put world energy use in 1960 at 40,589 terawatt-hours, or 4.63 trillion watts averaged over the year. Remove traditional biomass, meaning wood, crop waste and charcoal, and the figure falls to 3.62 trillion.
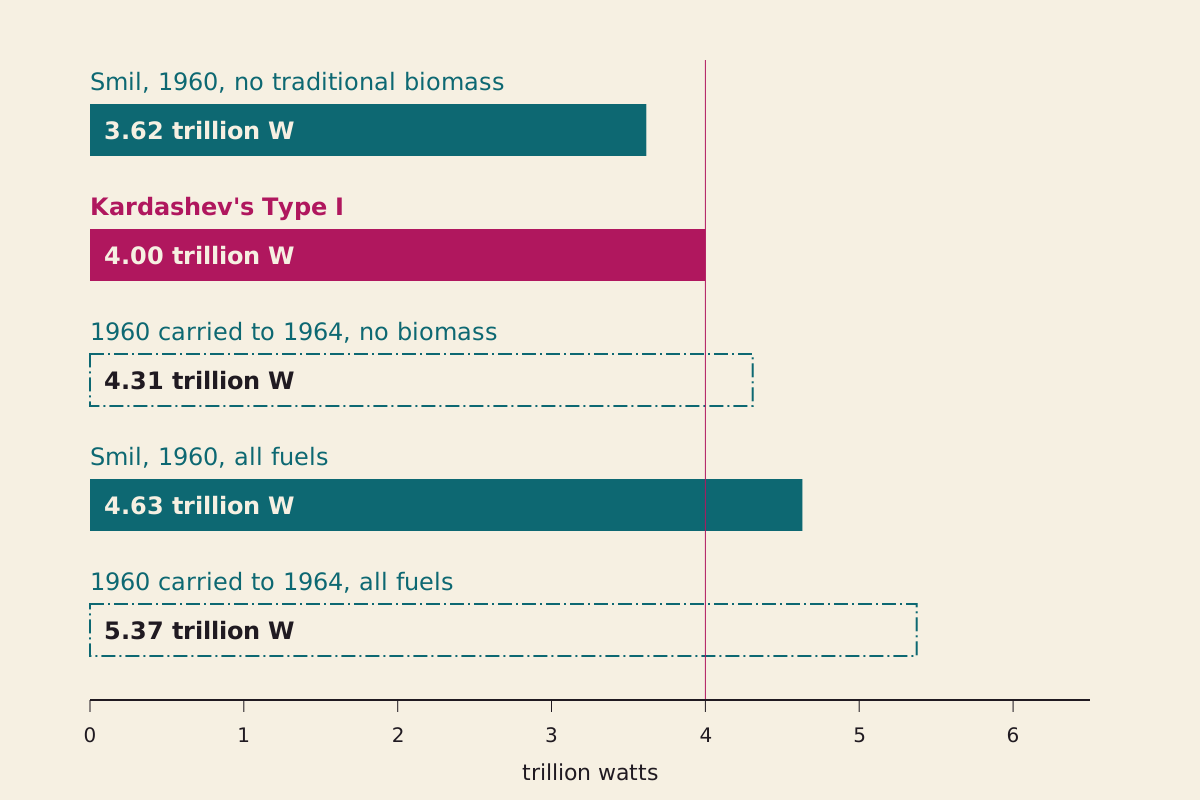
Kardashev's figure against Smil's 1960 reconstruction, with and without traditional biomass. Dashed bars carry the 1950s growth rate four more years, which is our own step.
"Kardashev's Type I against world energy use around 1964" by The What-If Observatory, https://whatifobservatory.com/estimates/kardashev-scale/, licensed under CC BY 4.0 (https://creativecommons.org/licenses/by/4.0/)
Data: Vaclav Smil (2017) via Our World in Data (world energy, 1950 and 1960); Ćirković 2015, quoting Kardashev 1964
His number falls between those two. Smil's rows there run by decade and end at 1960, with none for 1964, so we carry the 1950s pace forward four more years. That gives 4.31 to 5.37 trillion watts, or 1.08 to 1.34 times his figure.
We do not know what Kardashev counted, and a reconstruction published decades later is not what he had in front of him. Even so, his phrase “close to” holds up against it. Seeing: hazy.
Who moved Type I?
Two later moves pushed the rung upward, and nothing we could read ties either one to a new measurement of Earth.
Step 3: Sagan's formula. In 1973, Carl Sagan wanted finer divisions than three whole types, so he set Type 1.0 at a civilization using 10^16 watts for interstellar communication and made each whole type ten billion times the last, a setup that Jason Wright's 2020 review also describes. Ćirković writes it as a formula: type = 1 + 0.1 × log10(power ÷ 10^16 watts). Kardashev's own Type I scores 0.66 on it, and Sagan, in the passage Ćirković quotes, placed his own civilization at “something like Type 0.7” (sec. 2). Seeing: hazy.
Ćirković says the formula agrees with Kardashev's initial estimates within an order of magnitude. On the numbers he quotes, we find that true only at Type II, where the gap is 4 times, against 40 times at Type III and 2,500 times at Type I.
Step 4: the planet reading. Ćirković also gives what he calls the more conventional reading, a civilization using the “energy resources of its home planet” (sec. 1), and names a 1966 book by Shklovskii and Sagan, Intelligent Life in the Universe, as its starting text, which we could not read. The reading is not careless, because the three types do line up with planets, stars and galaxies, as he points out.
That wording names no wattage, so any figure has to be attached to it. For comparison, Ćirković gives sunlight across Earth's cross-section as about 1.74 × 10^17 watts. A 2025 preprint by Jonathan Jiang and Prithwis Das uses a threshold of 2.03 × 10^17 watts, the low end of its range for planets around G-type stars like the Sun, and also runs 10^16. Seeing: hazy.
| Year | Who | What Type I means | Watts | Times the 1964 figure |
|---|---|---|---|---|
| 1964 | Kardashev, per Ćirković | Near Earth's level at the time | 4 × 10^12 | 1 |
| 1966 | Shklovskii and Sagan, per Ćirković | The home planet's energy resources | none given | none |
| 1973 | Sagan, per Ćirković | Type 1.0 on a smooth scale | 10^16 | 2,500 |
| 2015 | Ćirković, as a comparison | Sunlight on Earth (our pairing) | 1.74 × 10^17 | 43,500 |
| 2025 | Jiang and Das, preprint | Low end of its range for planets around G-type stars; it also runs 10^16 | 2.03 × 10^17 | 50,750 |
Download kardashev-type-i-definitions.csv (where its values come from)
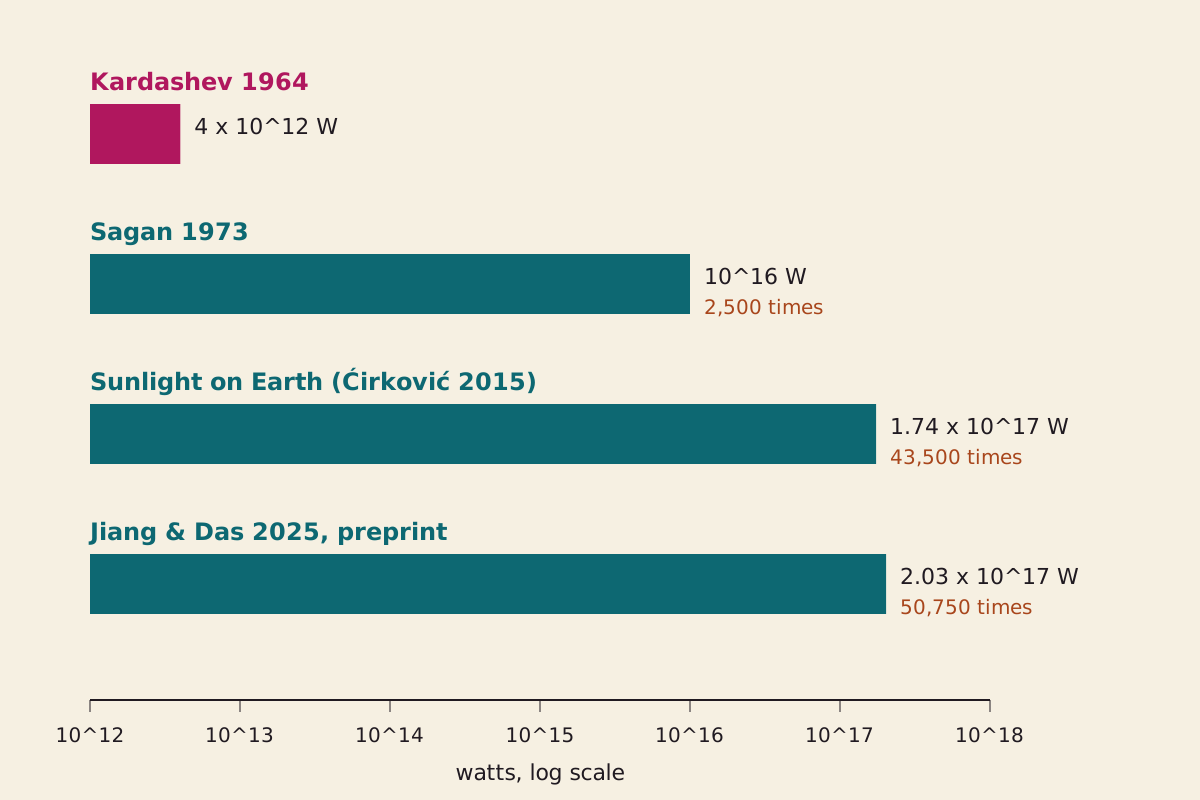
Four wattages set against Type I, one of them our own pairing. The bars are on a log scale, so each gridline is ten times the last.
"Four wattages set against Type I" by The What-If Observatory, https://whatifobservatory.com/estimates/kardashev-scale/, licensed under CC BY 4.0 (https://creativecommons.org/licenses/by/4.0/)
Ćirković himself warns that the energy values “should not be taken literally,” which is fair for a scale that sorts by rough size (sec. 2). The gap matters here only because some accounts present the planet version as Kardashev's own, as the 2025 preprint does, and the list as quoted says something else.
Where is Earth?

A power house mechanic working on a steam pump, photographed by Lewis Hine in 1920. It shows the energy business long before the scale existed, and it is not a reading on it.
"Power house mechanic working on steam pump" by Lewis Hine — https://commons.wikimedia.org/wiki/File:Lewis_Hine_Power_house_mechanic_working_on_steam_pump.jpg — Public domain in the US (published before 1931) and in the EU (author died 1940, life+70); modified: cropped to 16:9, keeping the head, arms and wrench; the upper pipes and the legs removed

In 2022, Earth sat at about 0.73 on Sagan's formula, already about five times Kardashev's own Type I. We take two roads to the world's power use, and they do not cover the same year.
Step 5: two readings. Road 1 is the US Energy Information Administration, which puts world primary energy, meaning fuels and other raw sources before any conversion, at about 600 quadrillion British thermal units in 2022. That converts to 2.01 × 10^13 watts. Seeing: hazy, because the same agency prints a second figure for that year and we did not read its counting rules.
Road 2 is Ćirković's figure for 2012, 1.77 × 10^13 watts, which he rates at 0.72 and we compute as 0.725. Seeing: hazy.
They land 1.13 times apart. We do not claim two-road agreement, our name for two estimates of the same quantity, from different main sources, within 3 times of each other. The years differ by a decade, and Ćirković's sentence names no upstream source, so we cannot show that his road starts from different data. Each reading keeps its own rating.
Both roads also assume that a single yearly world total means something, and neither page we read spells out all of its counting rules.
The same agency's 2023 outlook gives 638 quadrillion Btu for 2022, which is 1.06 times the first figure, and the pages we read do not explain the difference. It barely matters on this scale, since 2.13 × 10^13 watts still scores 0.73.
What does 0.73 mean?
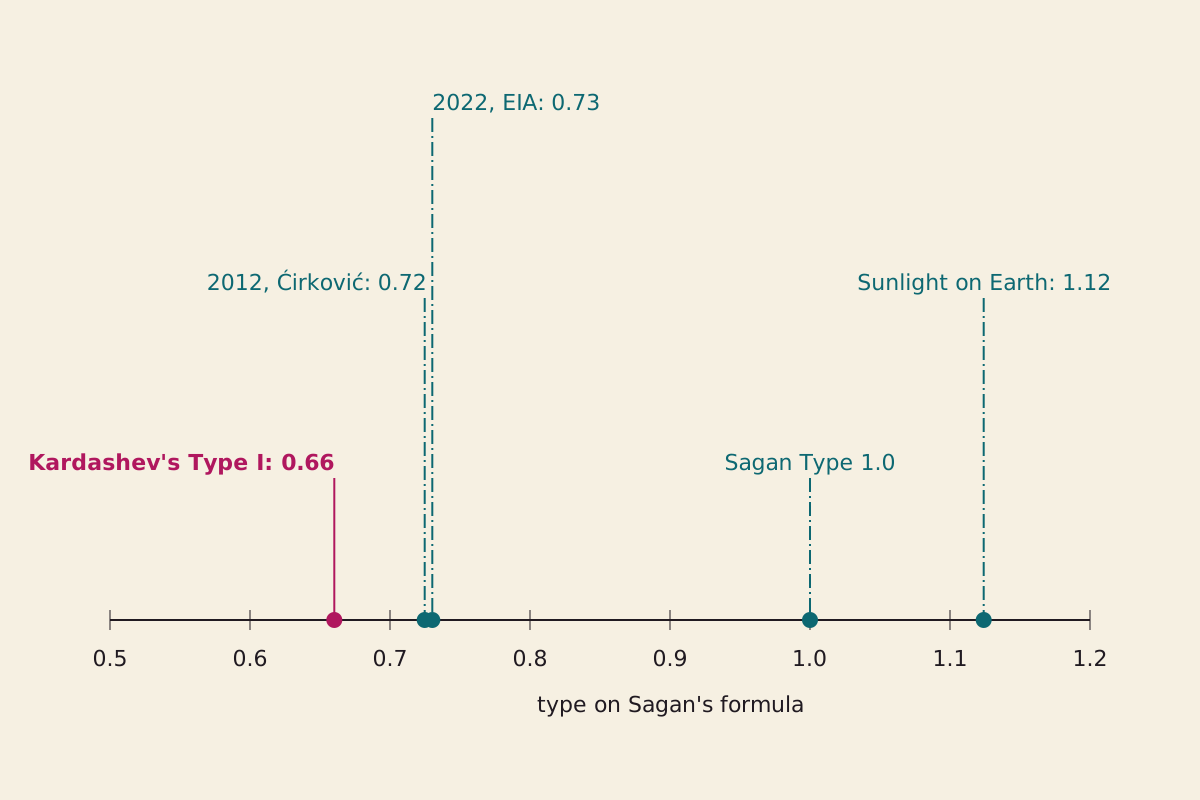
Earth's readings on Sagan's formula. Each step of 0.1 on this line is ten times the power.
"Earth's readings on Sagan's formula" by The What-If Observatory, https://whatifobservatory.com/estimates/kardashev-scale/, licensed under CC BY 4.0 (https://creativecommons.org/licenses/by/4.0/)
Data: US Energy Information Administration (2022 world energy); Ćirković 2015 (2012 figure, sunlight on Earth, the formula)
A reading of 0.73 sounds nearly finished, but the formula is logarithmic, so it is not a percentage. Reaching 1.0 takes about 499 times the power of Road 1, and Sagan's Type 1.0 would equal about 5.7 percent of the sunlight reaching Earth, against about 0.012 percent for Road 1.
Spread over the 8.02 billion people alive in 2022, the UN figure at Our World in Data, Road 1 comes to about 2,500 watts each, day and night, including industry and transport. Our count of how many people have ever lived shows how recent a crowd of that size is.
The scale grew out of the search for other civilizations, as a rough gauge of what might be detectable, which is why it keeps turning up beside the Fermi paradox.
How long to Type I?
Sagan's Type 1.0 is about 499 times Road 1, and sunlight on Earth is about 8,674 times, so the waiting time depends almost entirely on one growth rate.
Step 6: the rates. The agency's 2023 outlook runs from 638 quadrillion Btu in 2022 to 855 in 2050 in its Reference case, and to between 739 and 999 across its other cases. We convert those to 1.05 percent a year, within a span of 0.53 to 1.61 percent, while Smil's two rows give 3.79 percent for the 1950s. Seeing: hazy.
The dotted line falls after step 6. Up to there, each number has a named source or a stated assumption, but step 7 holds one rate steady for centuries, and no source we read can vouch for that. From here on, we are guessing.
Step 7: run the rate. Start from Road 1 and hold the growth constant, which is arithmetic and not a forecast. The table prints rounded rates, but the years come from the unrounded ones, so redoing the first row with 0.53 percent gives about 1,175 instead of 1,183. Seeing: overcast.
| Growth a year | Basis | Years to 10^16 W | Years to 1.74 × 10^17 W | Seeing |
|---|---|---|---|---|
| 0.53% | Our steady-rate run from EIA lowest case | 1,183 | 1,728 | overcast |
| 1.05% | Our steady-rate run from EIA Reference case | 594 | 867 | overcast |
| 1.61% | Our steady-rate run from EIA highest case | 388 | 566 | overcast |
| 3.79% | Our steady-rate run from the world's 1950s pace | 167 | 244 | overcast |
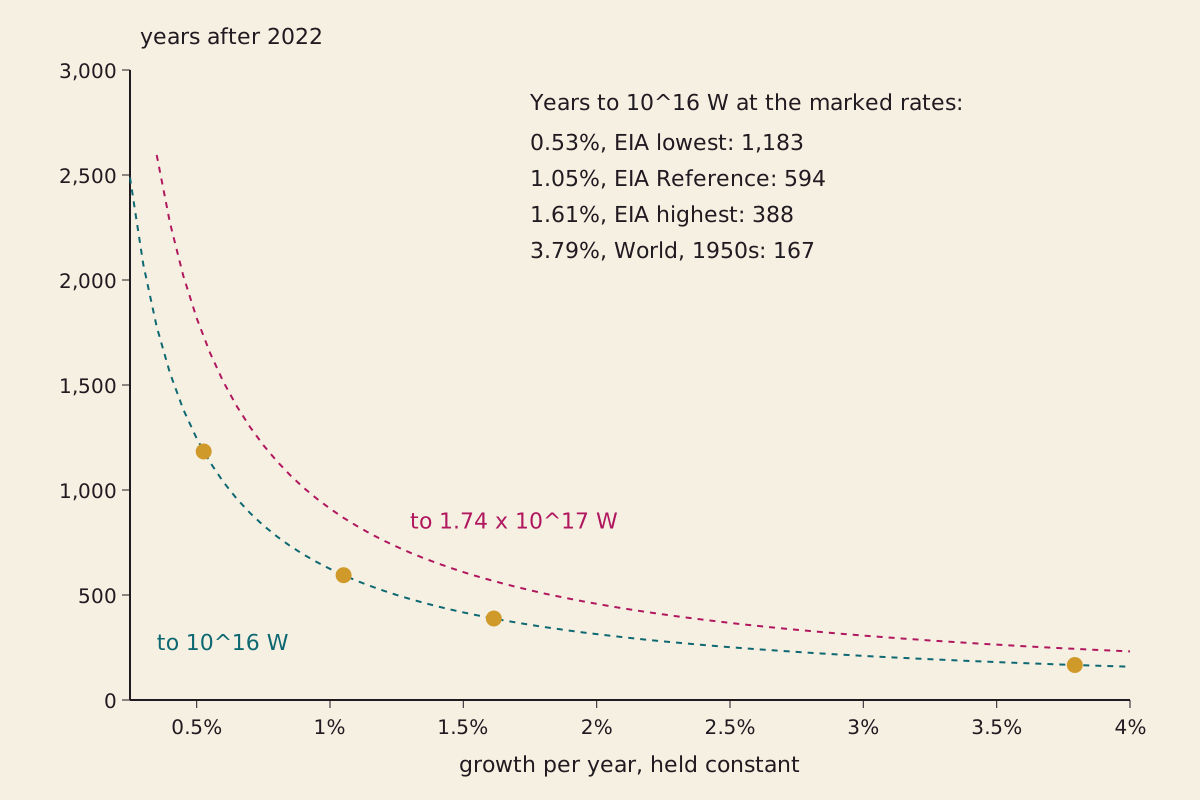
Years after 2022 to reach each threshold if one growth rate held the whole way. Both lines are dashed because they sit past the dotted line.
"Years to reach two thresholds at a constant growth rate" by The What-If Observatory, https://whatifobservatory.com/estimates/kardashev-scale/, licensed under CC BY 4.0 (https://creativecommons.org/licenses/by/4.0/)
Data: US Energy Information Administration (2022 world energy, outlook cases); Vaclav Smil (2017) via Our World in Data (1950s rate); Ćirković 2015 (thresholds)
Ćirković expected growth to reach Type 1 “very soon” (sec. 2) on timescales that are negligible in astrophysical terms, and a few centuries does qualify by that measure. Steady percentages look tame until you run them, a point that Moore's law makes with chips. Jiang and Das reach about 2271 CE in their simulation for 2.03 × 10^17 watts, with nuclear power growing 1.57 percent a year, while their own table runs as late as about 3235 on other settings.
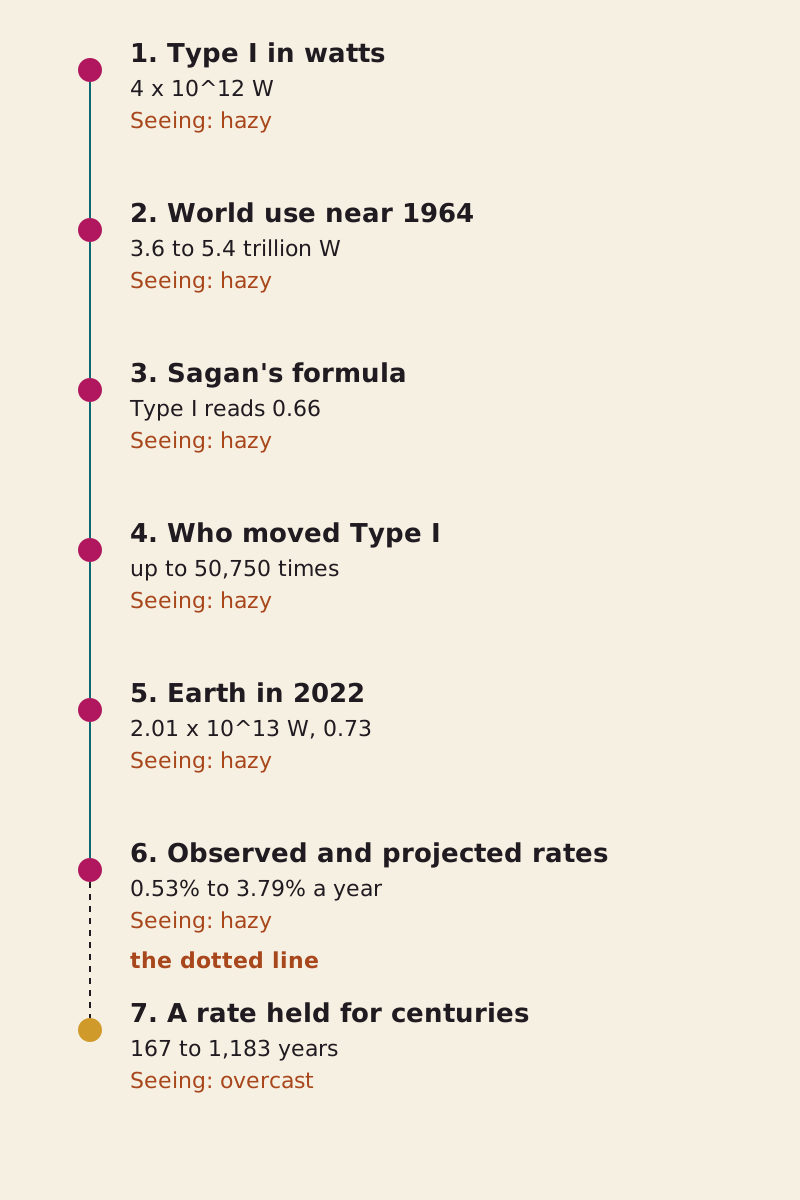
The chain behind this page. Steps 1 to 6 rest on sources and stated assumptions. Step 7 sits past the dotted line.
"Kardashev scale chain" by The What-If Observatory, https://whatifobservatory.com/estimates/kardashev-scale/, licensed under CC BY 4.0 (https://creativecommons.org/licenses/by/4.0/)
The 0.73 can be checked against next year's totals, but the centuries cannot. We are guessing from the moment one rate has to last that long.
Check my math:
| Step | Input | Value | Unit | Source no. | Source | Recomputed | Seeing |
|---|---|---|---|---|---|---|---|
| 1 | Kardashev's Type I | 4 × 10¹⁹ | erg/s | 1, 2 | secondary | no | hazy |
| 1 | Type I in watts | 4 × 10¹² | W | 1, 2 | secondary | yes | hazy |
| 1 | Type II in watts | 4 × 10²⁶ | W | 1, 2 | secondary | yes | hazy |
| 1 | Type III in watts | 4 × 10³⁷ | W | 1, 2 | secondary | yes | hazy |
| 2 | World energy use in 1960, all fuels | 4.63 × 10¹² | W | 6 | secondary | yes | hazy |
| 2 | World energy use in 1960, no traditional biomass | 3.616 × 10¹² | W | 6 | secondary | yes | hazy |
| 2 | World energy use in 1950, all fuels | 3.191 × 10¹² | W | 6 | secondary | yes | hazy |
| 2 | World energy use in 1950, no traditional biomass | 2.335 × 10¹² | W | 6 | secondary | yes | hazy |
| 2 | 1960 carried to 1964, all fuels | 5.374 × 10¹² | W | 6 | site assumption | yes | hazy |
| 2 | 1960 carried to 1964, no traditional biomass | 4.307 × 10¹² | W | 6 | site assumption | yes | hazy |
| 3 | Sagan Type 1.0 | 10¹⁶ | W | 2, 3, 4 | secondary | no | hazy |
| 3 | Kardashev's Type I on Sagan's formula | 0.66 | type | 2, 3 | secondary | yes | hazy |
| 3 | Sagan Type 1.0 over Kardashev Type I | 2,500 | times | 2, 3 | secondary | yes | hazy |
| 3 | Kardashev Type II over Sagan Type 2.0 | 4 | times | 2, 3 | secondary | yes | hazy |
| 3 | Kardashev Type III over Sagan Type 3.0 | 40 | times | 2, 3 | secondary | yes | hazy |
| 4 | Sunlight on Earth | 1.74 × 10¹⁷ | W | 2, 9 | secondary | no | hazy |
| 4 | Sunlight on Earth over Kardashev Type I | 43,500 | times | 2 | site assumption | yes | hazy |
| 4 | Threshold in a 2025 preprint | 2.03 × 10¹⁷ | W | 9 | primary | no | hazy |
| 4 | That threshold over Kardashev Type I | 50,750 | times | 2, 9 | site assumption | yes | hazy |
| 5 | World primary energy, 2022, Road 1 | 600 | quads/yr | 7 | primary | no | hazy |
| 5 | Road 1 in watts | 2.006 × 10¹³ | W | 7 | primary | yes | hazy |
| 5 | Same year in the 2023 outlook | 2.133 × 10¹³ | W | 8 | primary | yes | hazy |
| 5 | World power, 2012, Road 2 | 1.77 × 10¹³ | W | 2 | secondary | no | hazy |
| 5 | Road 1 over Road 2 | 1.133 | times | 2, 7 | site assumption | yes | hazy |
| 5 | Road 1 on the formula | 0.73 | type | 2, 3, 7 | secondary | yes | hazy |
| 5 | Outlook figure on the formula | 0.733 | type | 2, 3, 8 | secondary | yes | hazy |
| 5 | Road 2 on the formula | 0.725 | type | 2, 3 | secondary | yes | hazy |
| 5 | Road 1 over Kardashev Type I | 5.01 | times | 2, 7 | secondary | yes | hazy |
| 5 | Road 1 per person | 2,501 | W per person | 7, 10 | site assumption | yes | hazy |
| 6 | EIA Reference case growth | 1.051 | %/yr | 8 | site assumption | yes | hazy |
| 6 | EIA lowest case growth | 0.526 | %/yr | 8 | site assumption | yes | hazy |
| 6 | EIA highest case growth | 1.614 | %/yr | 8 | site assumption | yes | hazy |
| 6 | 1950s growth, all fuels | 3.793 | %/yr | 6 | site assumption | yes | hazy |
| 7 | Years to 1e16 W at EIA low case | 1,183 | years | 2, 7, 8 | site assumption | yes | overcast |
| 7 | Years to 1e16 W at EIA Reference case | 594 | years | 2, 7, 8 | site assumption | yes | overcast |
| 7 | Years to 1e16 W at EIA high case | 388 | years | 2, 7, 8 | site assumption | yes | overcast |
| 7 | Years to 1e16 W at 1950s pace, all fuels | 167 | years | 2, 6, 7 | site assumption | yes | overcast |
| 7 | Years to 1.74e17 W at EIA low case | 1,728 | years | 2, 7, 8 | site assumption | yes | overcast |
| 7 | Years to 1.74e17 W at EIA Reference case | 867 | years | 2, 7, 8 | site assumption | yes | overcast |
| 7 | Years to 1.74e17 W at EIA high case | 566 | years | 2, 7, 8 | site assumption | yes | overcast |
| 7 | Years to 1.74e17 W at 1950s pace, all fuels | 244 | years | 2, 6, 7 | site assumption | yes | overcast |
| 7 | Year in a 2025 preprint | 2,271 | CE | 9 | primary | no | overcast |
Download kardashev-check-my-math.csv (where its values come from)
Powers use the Julian year of 31,557,600 seconds and 1,055.056 joules per Btu. Units were checked, and the computed numbers in the text were compared with the CSV. The world figures are as of the agency's page last updated April 11, 2024, and get rechecked within 12 months.
Ćirković gives page 219 of Kardashev's paper for the list and page 234 of the 2000 edition of Sagan's book for the passage, and we read those pages only through him. His own wording here is on pages 2 and 5 of the arXiv preprint.
Next question:
- How many meters thick is Jupiter, spread into a sphere? The Dyson sphere, by mass and area
- What if chips kept doubling? Moore's law, against the chips
Sources
- Nikolai S. Kardashev (1964). “Transmission of Information by Extraterrestrial Civilizations.” Soviet Astronomy 8:217. Original Read: bibliography only; quoted through Ćirković 2015.
- Milan M. Ćirković (2015). “Kardashev's Classification at 50+: A Fine Vehicle with Room for Improvement.” Serbian Astronomical Journal 191:1–15. arXiv:1601.05112. Original Read: preprint, sections 1 and 2 and references.
- Carl Sagan (1973). The Cosmic Connection: An Extraterrestrial Perspective. Anchor Press/Doubleday. Original Read: bibliography only; quoted through Ćirković 2015.
- Jason T. Wright (2020). “Dyson Spheres.” Invited review, arXiv:2006.16734. Original Read: preprint, sections 1 to 3 and references.
- I. S. Shklovskii, Carl Sagan (1966). Intelligent Life in the Universe. Holden-Day. Original Read: bibliography only; named by Ćirković 2015.
- Our World in Data. “Global primary energy use by source.” Upstream before 1965: Vaclav Smil (2017), Energy Transitions: Global and National Perspectives, 2nd edition, Appendix A. Original Read: single value via Our World in Data: world rows for 1950 and 1960.
- US Energy Information Administration. “What is the United States' share of world energy consumption?” Frequently Asked Questions, last updated April 11, 2024. Original Read: full FAQ answer.
- US Energy Information Administration. International Energy Outlook 2023, narrative, October 2023. Original Read: chapter of the narrative: world totals for 2022 and 2050 and the range across cases.
- Jonathan H. Jiang, Prithwis Das (2025). “From Earthbound to Stars: Analyzing Humanity's Path to a Type II Civilization.” arXiv:2510.03249, a preprint. Original Read: preprint, abstract, Tables 1 and 2. Text license: CC BY 4.0.
- Our World in Data. “Population” (long-run data). Upstream: HYDE 3.3 (10,000 BCE to 1799), Gapminder v7 (1800 to 1949), UN World Population Prospects 2024 (1950 onward). Original Read: single values via Our World in Data: world figures for the years each page lists, United States and United Kingdom for a few years; all listed world years through 1950 summed as a check, not reproduced.
Cite this page
The What-If Observatory. "Kardashev Scale: 2022 Energy Use Is About 5x the 1964 Type I." Published 2026-11-09. https://whatifobservatory.com/estimates/kardashev-scale/. Add the date you read it.
Corrections
None so far.